CAPITAL ADEQUACY
Capital adequacy is a measure of the financial soundness and the stability of the Bank which is expressed as a ratio of its Capital to Risk Weighted Assets
of Credit, Market and Operational aspects of the business.
Regulatory Capital
The Central Bank of Sri Lanka (CBSL) sets and monitors capital requirements for Licensed Banks in Sri Lanka based on the Basel framework which is an
international standard for banks’ capital adequacy, stress testing and liquidity requirements. As a Domestically Systemically Important Bank (D-SIB), Bank
of Ceylon requires to maintain a minimum Common Equity Tier 1 Ratio of 8.5 %, Tier 1 Ratio of 10% and Total Capital Ratio of 14% according to the
Banking Act Direction No 01 of 2016 and subsequent amendments thereto issued by the CBSL.
Bank of Ceylon has continued to well maintain Capital Adequacy Ratios over and above the Regulatory Capital Requirements. Following comparison
demonstrates the Minimum Regulatory Requirements and the actual positions of Bank of Ceylon.
Components of the Capital
Minimum Regulatory
Requirement from
01.01.2019
%
Bank’s position as at
31.12.2020
%
31.12.2021
%
31.12.2022
%
31.12.2023
%
Common Equity Tier 1 (CET 1)
8.50
10.09
12.91
11.34
11.71
Total Tier 1
10.00
11.22
14.25
12.41
12.76
Total Capital
14.00
14.88
17.77
15.38
15.84
Below chart, depicts the components of the Bank’s capital with its compliance imposed by the Regulator.
CAPITAL ADEQUACY - BANK
2020
2021
2022
2023
0
2
4
6
8
10
12
14
16
18
20
Total Tier 1
Regulatory Requirement (Tier 1)
Regulatory Requirement (Total Capital)
Total Capital
%
Sources of Capital
The business plans and financial plans are
prepared ensuring adequate profit generation
by setting appropriate targets for Return on
Assets and Capital. The Bank was able to raise
LKR 10 billion by issuing Basel III compliant
– Tier 2, Listed, Unsecured, Subordinated,
Redeemable debentures in 2023 in order to
boost its capital levels.
Capital Management
The Bank has an ongoing process to evaluate
the adequacy of capital in line with strategic
aspirations and to comply with the BASEL III
guidelines. All large credit proposals are evaluated
with the required capital charge. Lending decisions
and property expansions are evaluated on the
basis of sufficient return on capital. In addition,
necessary actions are taken to optimise the Risk
Weighted Assets by improving asset quality in
order to enhance Capital Adequacy Ratios.
Moving forward, the Bank is executing the
identified medium and long term strategies to
improve Capital Adequacy Ratios in line with
CBSL Minimum Regulatory Requirements.
The Bank is committed to maintaining a strong
and resilient balance sheet by maintaining
optimum levels of capital adequacy in order to
comply with capital adequacy thresholds set by
the CBSL.

Basel III Disclosure Requirements Under Pillar 3 as per Banking Act Direction No 01 of 2016
Disclosure 1 : Key Regulatory Ratios - Capital and Liquidity
As at December 31,
2023
2022
Bank
Group
Bank
Group
Basel III
Regulatory Capital (LKR '000)
Common Equity Tier 1
204,342,671
215,172,411
194,949,918
200,533,817
Tier 1 Capital
222,692,671
233,448,400
213,299,918
218,883,817
Total Capital
276,409,883
288,363,582
264,494,074
270,747,789
Regulatory Capital Ratios (%)
Common Equity Tier 1 Capital Ratio (Minimum Requirement - 8.50%)
11.71
12.10
11.34
11.34
Tier 1 Capital Ratio (Minimum Requirement - 10.00%)
12.76
13.12
12.41
12.38
Total Capital Ratio (Minimum Requirement - 14.00%)
15.84
16.21
15.38
15.32
Leverage Ratio (Minimum Requirement - 3.00%)
4.78
4.95
4.59
4.65
As at December 31
Bank
2023
2022
Regulatory Liquidity
Statutory Liquid Assets - Domestic (LKR '000)
1,624,586,784
698,946,861
Statutory Liquid Assets - FCBU (USD '000)
607,206
368,308
Statutory Liquid Assets Ratio (Minimum Requirement - 20%)
Domestic Banking Unit (%)
42.80%
21.22
Off - Shore Banking Unit (%)
54.20%
32.79
Consolidated (%)
45.00%
23.00
Liquidity Coverage Ratio (%)- Rupee (Minimum Requirement 2023-100%, 2022-100%)
316.00
169.00
Liquidity Coverage Ratio (%)- All Currency (Minimum Requirement 2023-100%, 2022-100%)
227.21
122.77
Net Stable Funding Ratio (%) (Minimum Requirement 2023 -100%, 2022 -100%)
145.00
139.00

Disclosure 2 : Basel III Computation of Capital Ratios -31.12.2023
2023
2022
As at December 31
Bank
Group
Bank
Group
LKR '000
LKR '000
LKR '000
LKR '000
Common Equity Tier 1 (CET 1) Capital after Adjustments
204,342,671
215,172,411
194,949,918
200,533,817
Common Equity Tier 1 (CET 1) Capital
229,487,333
236,307,441
219,610,936
221,151,838
Equity Capital (Stated Capital)/ Assigned Capital
25,730,000
25,730,000
25,730,000
25,730,000
Reserve Fund
15,665,000
15,665,000
15,131,000
15,131,000
Published Retained Earnings/(Accumulated Retained Losses)
171,351,609
173,063,302
158,616,238
159,819,481
Published Accumulated other Comprehensive Income (OCI)
16,571,657
21,482,495
19,964,631
20,104,713
General and other Disclosed Reserves
169,067
366,644
169,067
366,644
Unpublished current year's profit/(losses) and gains reflected in OCI
-
-
-
-
Ordinary shares issued by consoloidated banking and financial subsidaries held by third
parties
-
-
-
Total Adjustments to CET 1 Capital
25,144,662
21,135,030
24,661,017
20,618,021
Goodwill (net)
-
-
-
-
Intangible Assests (net)
1,352,429
1,452,194
1,360,265
1,511,177
Revaluation losses of property, plant and equipment
52,913
52,913
52,913
52,913
Deferred tax assets (net)
18,580,248
18,644,378
18,903,174
18,924,249
Investments in the capital of banking and financial institutions where the bank does not own
more than 10 percent of the issued ordinary share capital of the entity
1,047,457
985,544
-
-
Significant investments in the capital of financial institutions where the bank owns more
than 10 percent of the issued ordinary share capital of the entity
4,111,614
-
4,214,983
-
Shortfall of capital in financial subsidiaries
-
-
129,682
129,682
Additional Tier 1 (AT I) capital after adjustment
18,350,000
18,350,000
18,350,000
18,350,000
Additional Tier 1 (AT I) capital
18,350,000
18,350,000
18,350,000
18,350,000
Qualifying Additional Tier 1 Capital Instruments
18,350,000
18,350,000
18,350,000
18,350,000
Instruments issued by Consolidated Banking and Financial Subsidiaries of the Bank and
held by Third Parties
-
-
-
-
Total Adjustments to AT 1 Capital
-
-
-
-
Investment in Own Shares
-
-
-
-
Others (specify)
Tier 2 Capital after Adjustments
53,717,211
54,915,182
51,194,155
51,863,972
Tier 2 Capital
53,795,872
54,915,182
51,194,155
51,863,972
Qualifying Tier 2 Capital Instruments
24,256,811
24,933,801
21,960,592
22,028,292
Revaluation Gains
9,902,177
9,902,177
9,902,177
9,902,177
General Provisions
19,636,885
20,079,205
19,331,387
19,933,503
Instruments issued by Consolidated Banking and Financial Subsidiaries of the Bank and
held by Third Parties
-
-
-
-
Total Adjustment to Tier 2
78,661
-
-
-
Investment in Own Shares
-
-
Investments in the capital of financial institutions and where the bank does not own more
than 10 percent of the issued capital carrying voting rights of the issuing entity
78,661
-
-
-
Significant investments in the capital of banking and financial institutions where the bank
own more than 10 percent of the issued ordinary share capital of the entity
-
-
-
-
CET I Capital
204,342,671
215,172,411
194,949,918
200,533,817
Total Tier 1 Capital
222,692,671
233,522,411
213,299,918
218,883,817
Total Capital
276,409,883
288,437,593
264,494,074
270,747,789

2023
2022
As at December 31
Bank
Group
Bank
Group
LKR '000
LKR '000
LKR '000
LKR '000
Total Risk Weighted Assets (RWA)
1,745,441,042
1,778,715,863
1,719,267,173
1,767,715,187
RWAs for Credit Risk
1,570,950,764
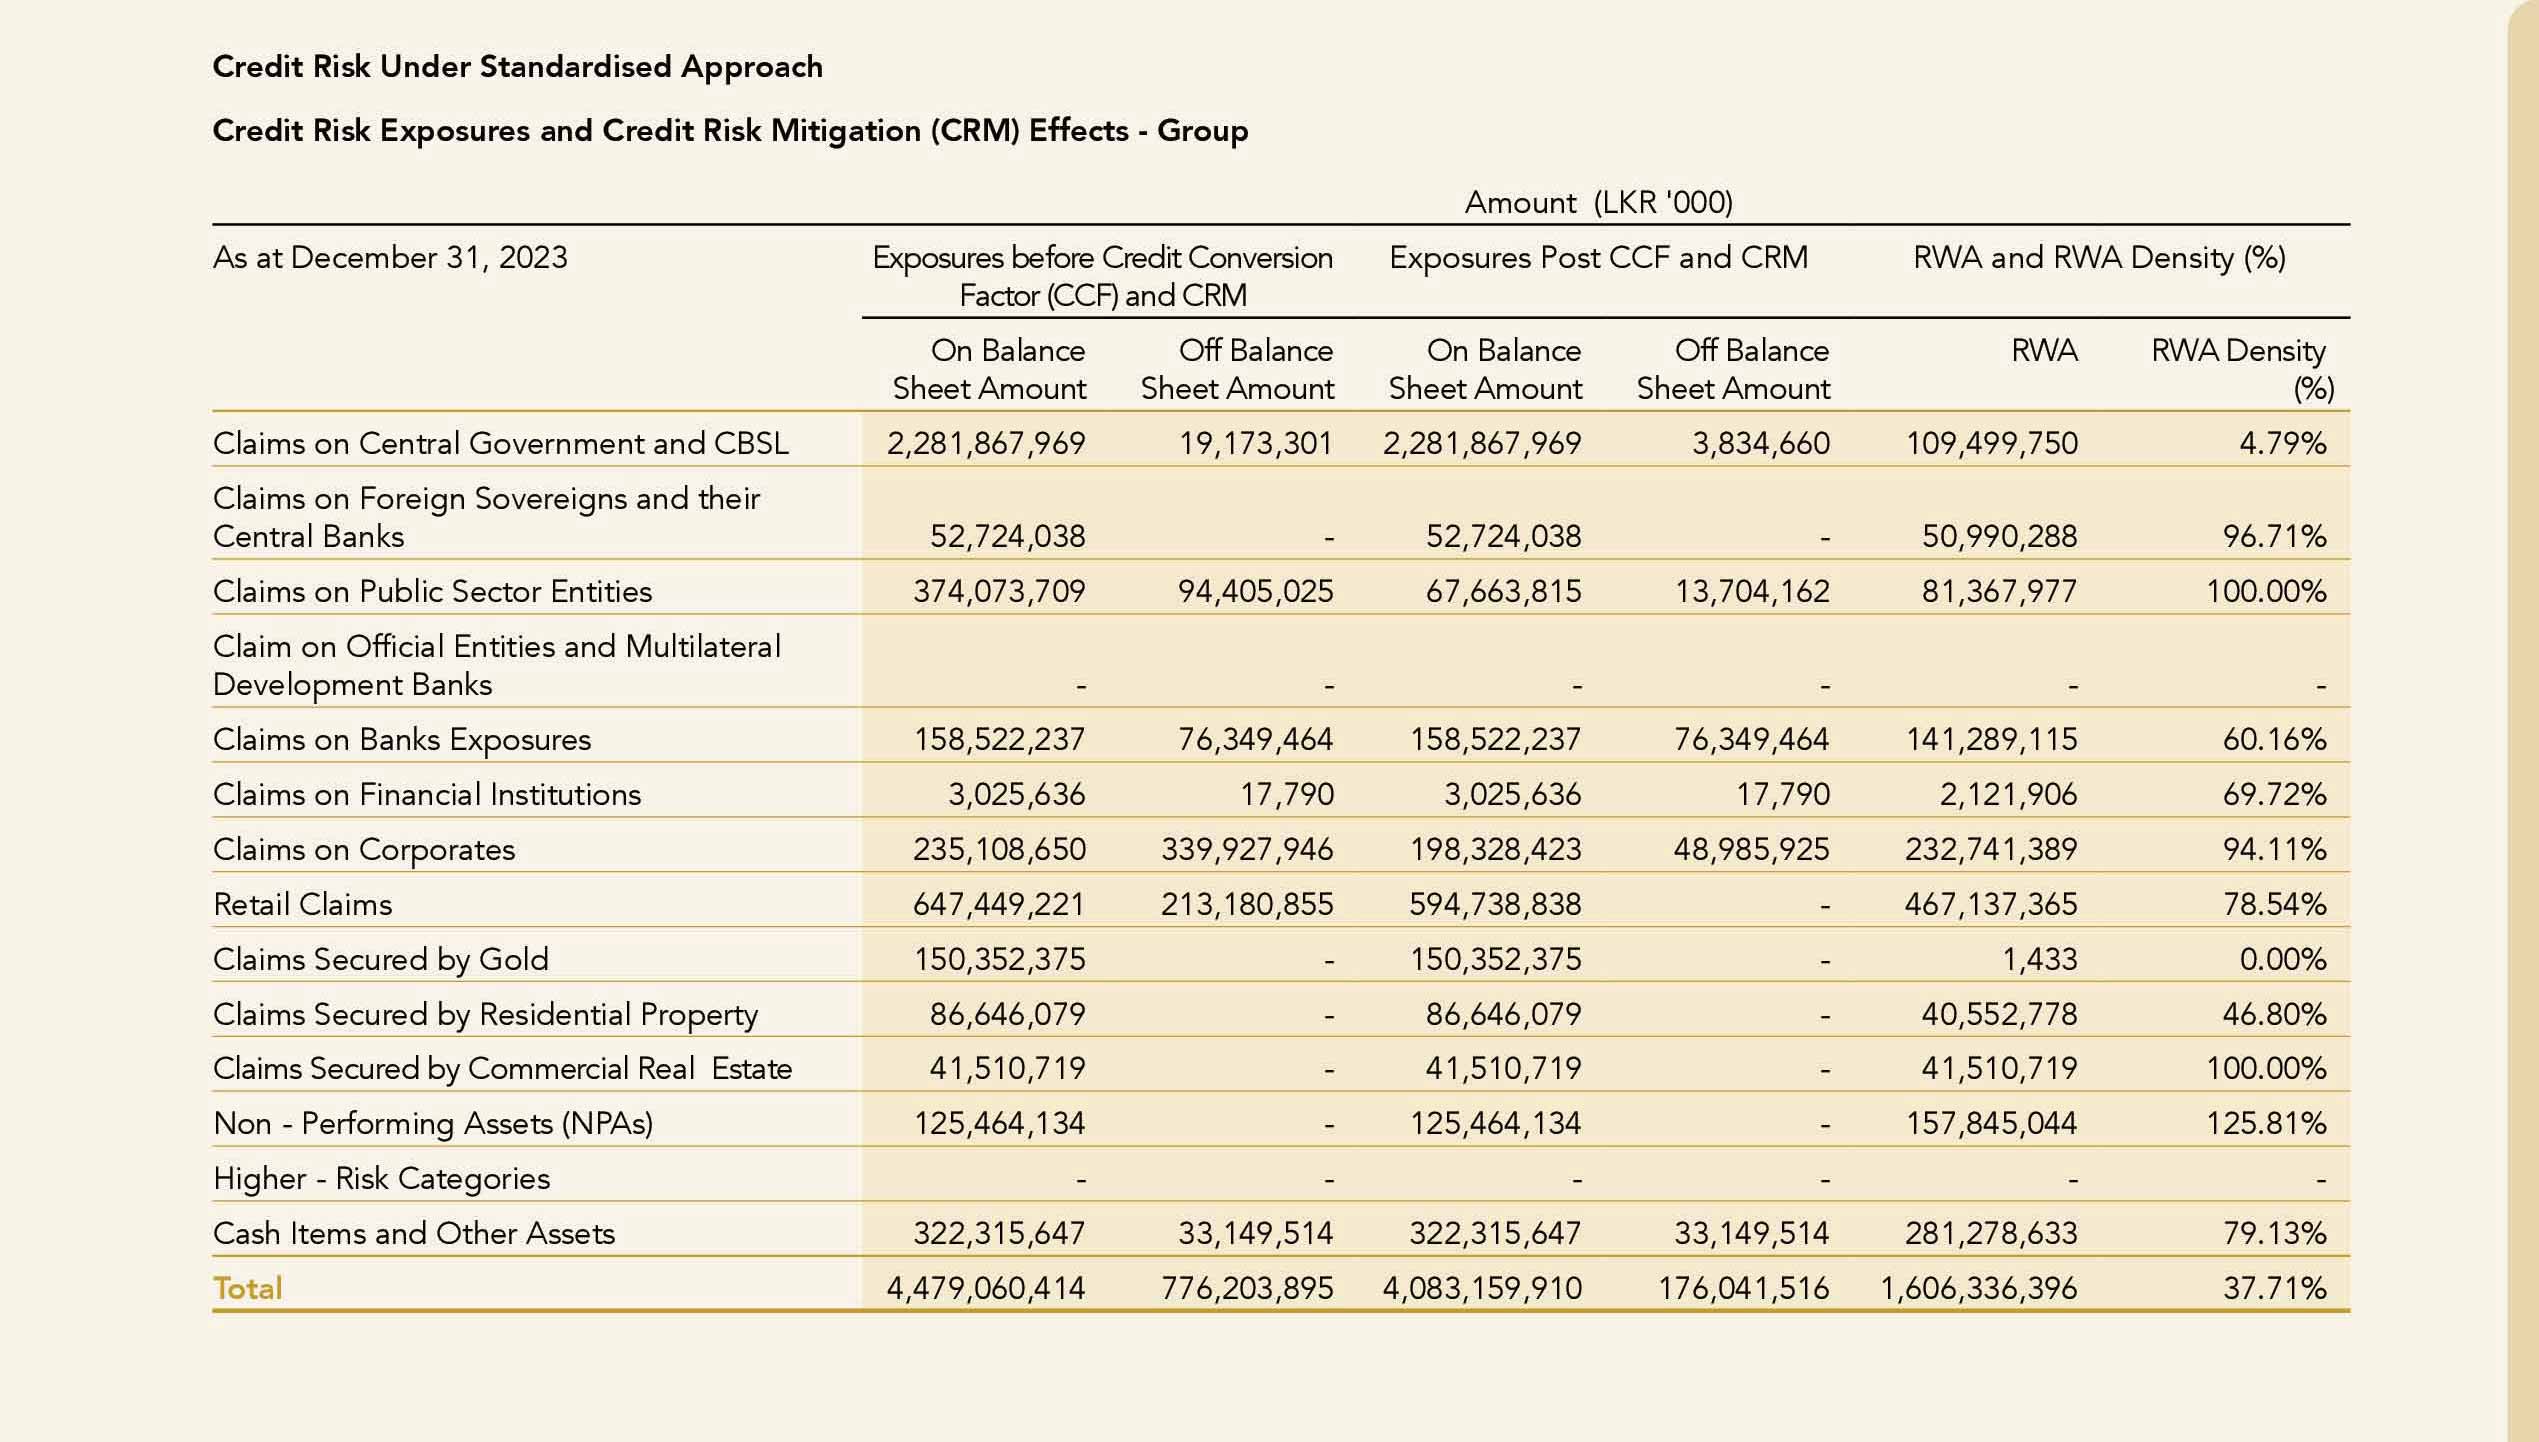
1,606,336,396
1,546,510,921
1,594,680,262
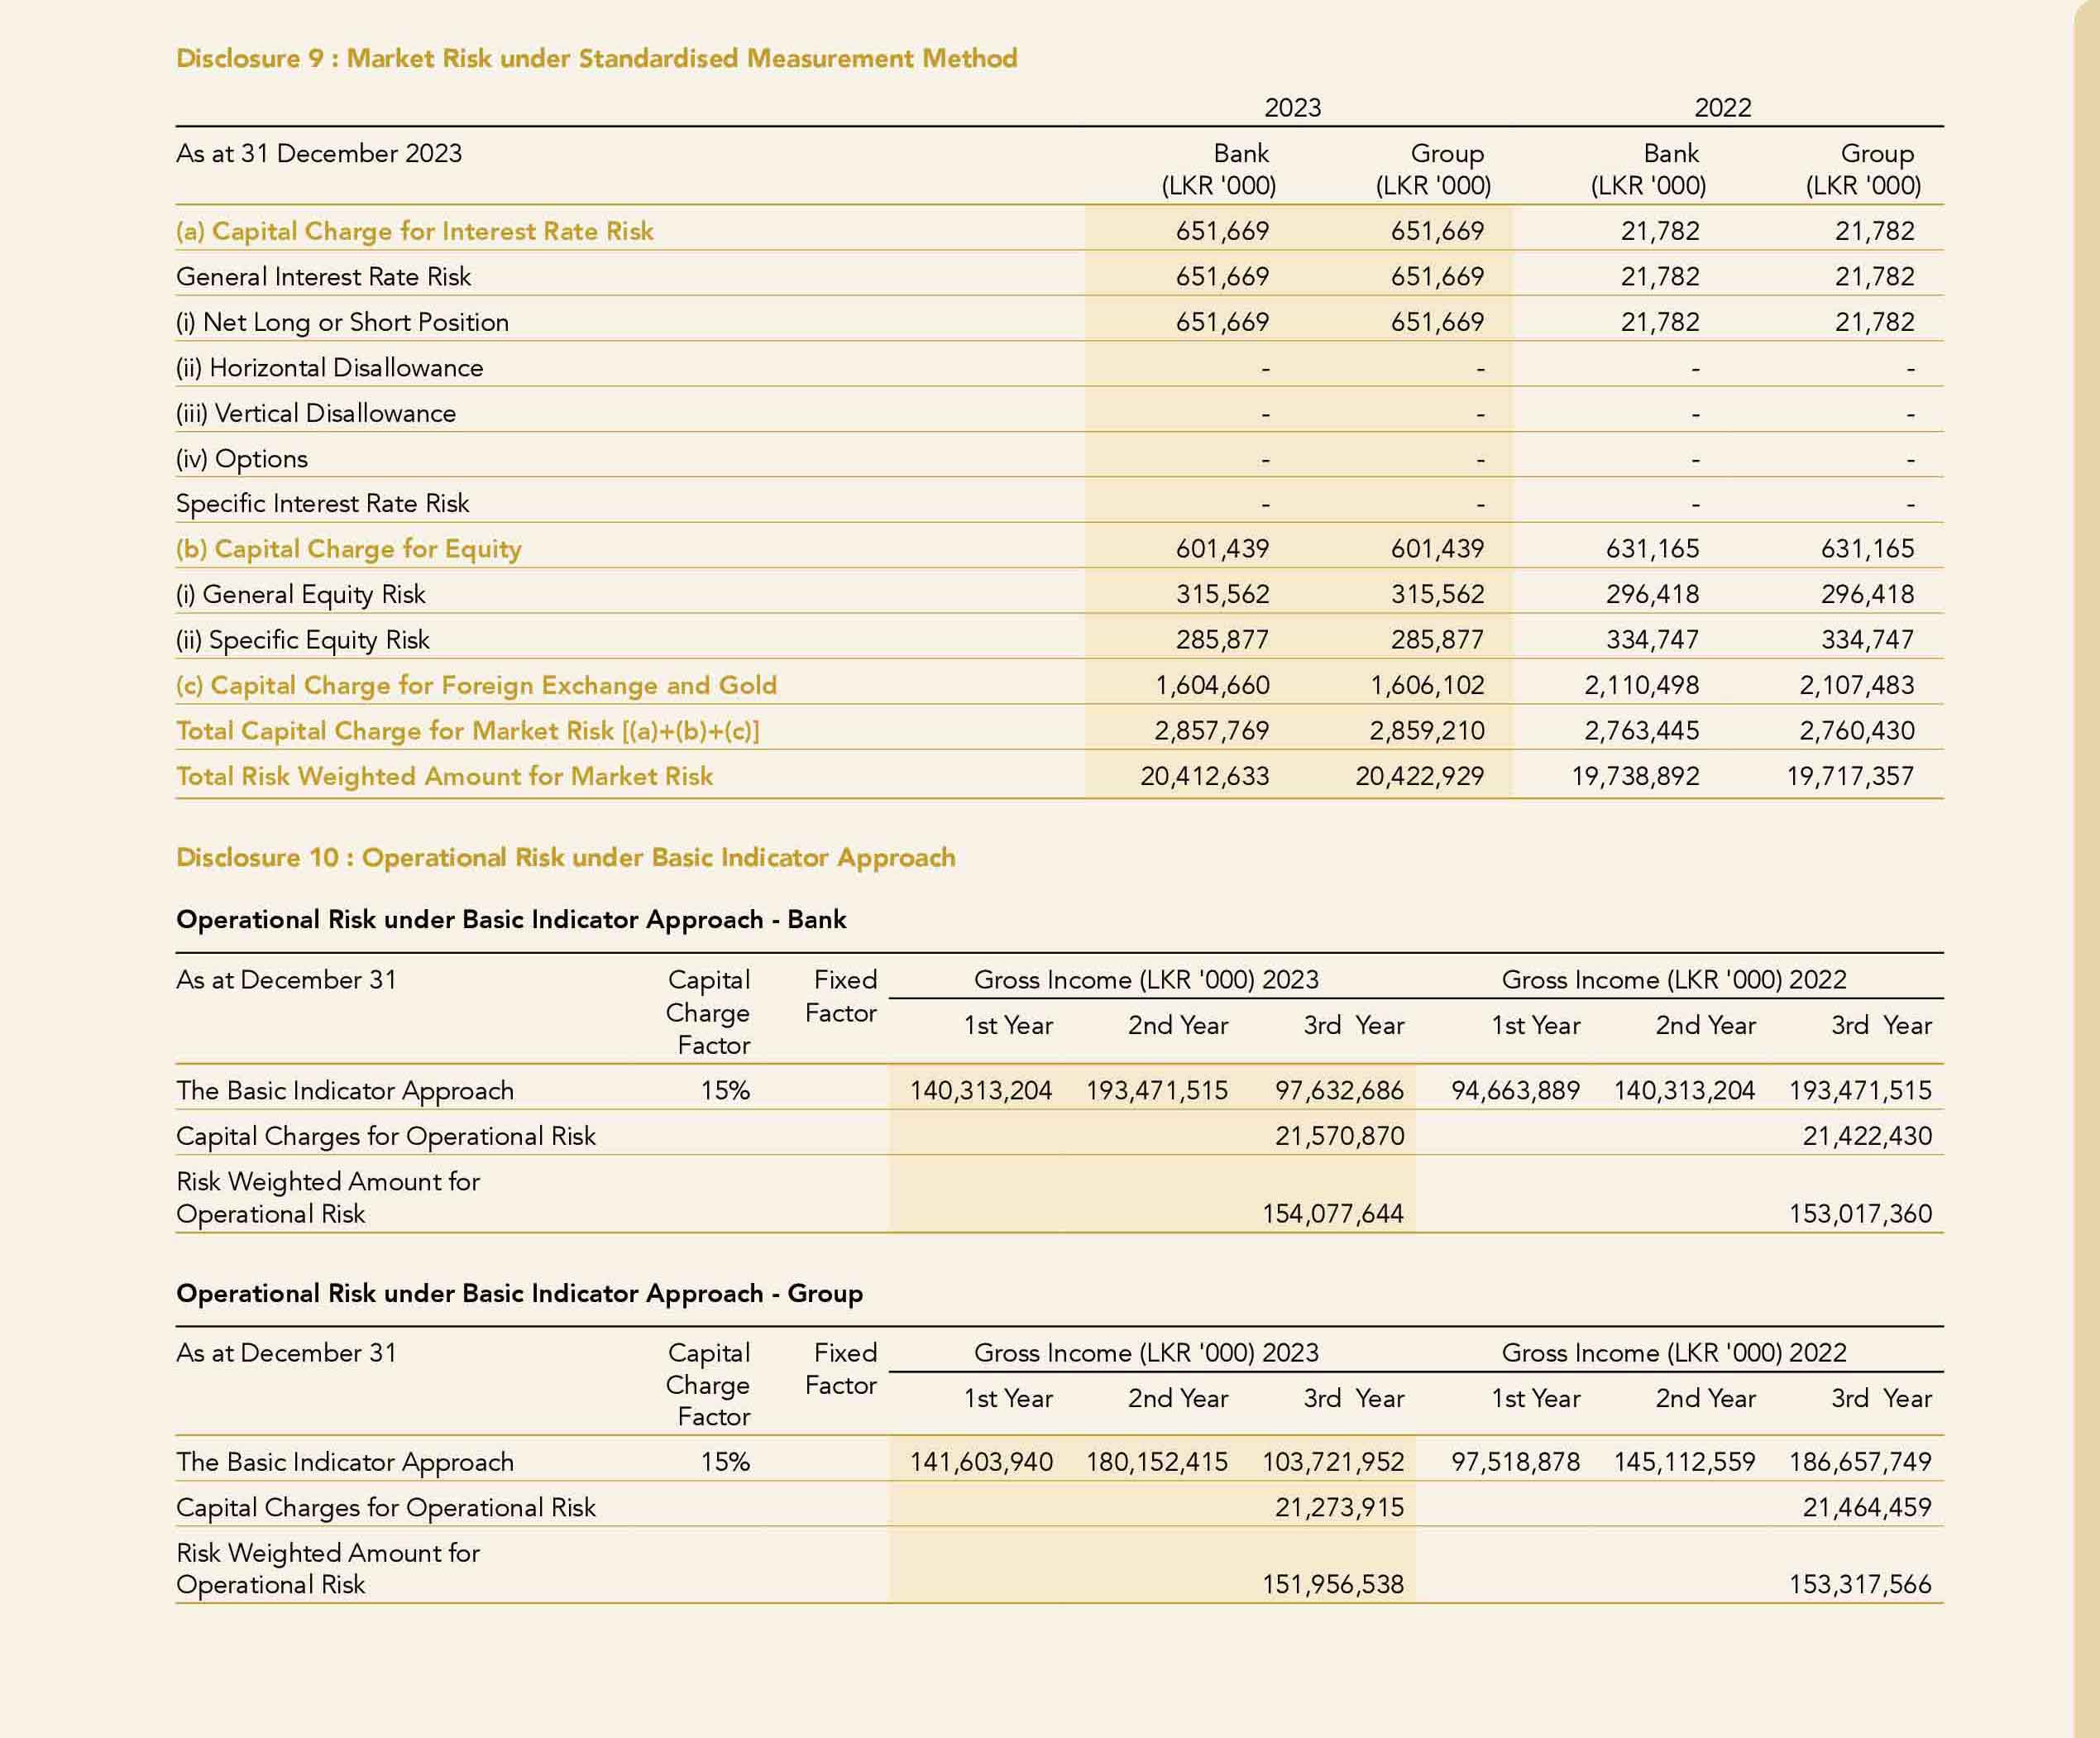
RWAs for Market Risk
20,412,633
20,422,929
19,738,892
19,717,359
RWAs for Operational Risk
154,077,644
151,956,538
153,017,360
153,317,566
CET I Capital Ratio (including Capital Conservation Buffer,
Countercyclical Capital Buffer and Surcharge on D-SIBs) (%)
11.71
12.10
11.34
11.34
of which : Capital Conservation Buffer (%)
2.50
2.50
2.50
2.50
of which : Countercyclical Buffer (%)
N/A
N/A
N/A
N/A
of which : Capital Surcharge on D-SIBs (%)
1.50
1.50
1.50
1.50
Total Tier 1 Capital Ratio (%)
12.76
13.13
12.41
12.38
Total Capital Ratio (including Capital Conservation Buffer, Countercyclical
Capital Buffer and surcharge on D-SIBs) (%)
15.84
16.22
15.38
15.32
of which : Capital Conservation Buffer (%)
2.50
2.50
2.50
2.50
of which : Countercyclical Buffer (%)
N/A
N/A
N/A
N/A
of which : Capital Surcharge on D-SIBs (%)
1.50
1.50
1.50
1.50
Disclosure 3 : Leverage Ratio
2023
2022
As at December 31
Bank
Group
Bank
Group
LKR '000
LKR '000
LKR '000
LKR '000
Tier 1 Capital
222,692,671
233,448,400
213,299,918
218,883,817
Total Exposures
4,657,073,328
4,715,305,253
4,646,589,230
4,703,126,805
On-Balance Sheet Items (Excluding Derivatives and Securities Financing
Transactions, but including Collateral)
4,361,075,626
4,415,824,079
4,251,645,878
4,307,950,487
Derivative Exposures
12,479,517
12,479,517
26,706,355
26,706,355
Securities Financing Transaction Exposures
80,374,807
83,858,280
183,736,863
183,969,828
Other Off-Balance Sheet Exposures
203,143,377
203,143,377
184,500,134
184,500,134
Basel III Leverage Ratio (%) (Tier 1 Capital/Total Excposure)
4.78
4.95
4.59
4.65
Disclosure 4 : Net Stable Funding Ratio (NSFR) and Liquidity Coverage Ratio (LCR)
As at December 31
2023
2022
LKR '000
LKR '000
Total Available Stable Funding
3,097,126,830
2,186,814,087
Required Stable Funding - On Balance Sheet Assets
2,119,759,169
1,652,394,020
Required Stable Funding - Off Balance Sheet Assets
12,851,224
14,220,143
Total Required Stable Funding
2,132,610,394
1,666,614,164
NSFR
145%
131%

Basel III computation of Liquidity Coverage Ratio - All Currency (Bank Only)
2023
2022
As at December 31,
Total
Un-Weighted
Value
Total
Weighted
Value
Total
Un-Weighted
Value
Total
Weighted
Value
LKR '000
LKR '000
LKR '000
LKR '000
Total Stock of High - Quality Liquid Asset (HQLA)
1,573,846,803
1,566,339,975
528,321,185
522,718,279
Total Adjusted Level I Assets
1,532,855,509
1,532,855,509
495,276,344
495,276,344
Level 1 Assets
1,530,225,982
1,530,225,982
496,650,654
496,650,654
Total Adjusted Level 2A Assets
40,867,380
34,737,273
29,235,313
24,850,016
Level 2A Assets
40,867,380
34,737,273
29,235,313
24,850,016
Total Adjusted Level 2B Assets
2,753,441
1,376,721
2,435,217
1,217,609
Level 2B Assets
2,753,441
1,376,721
2,435,217
1,217,609
Total Cash Outflows
4,412,609,059
851,520,467
4,143,573,873
591,674,653
Deposits
2,342,464,299
234,246,430
2,549,717,356
254,971,736
Unsecured Wholesale Funding
1,399,760,314
563,033,322
689,360,250
283,199,642
Secured Funding Transactions
61,244,586
-
347,682,220
-
Undrawn Portion of Committed (Irrevocable) Facilities and Other
Contingent Funding Obligations
601,301,767
46,402,622
556,814,047
53,503,275
Additional Requirements
7,838,093
7,838,093
-
Total Cash Inflows
236,636,601
162,135,509
312,827,811
165,920,811
Maturing Secured Lending Transaction Backed by Collateral
3,500,000
-
-
-
Committed Facilities
5,000,000
-
5,000,000
-
Other Inflows by Counterparty which are Maturing Within 30 Days
193,252,127
152,837,733
263,185,809
165,459,409
Operational Deposits
25,586,699
-
44,180,601
-
Other Cash Inflows
9,297,776
9,297,776
461,402
461,402
Liquidity Coverage Ratio (%) (Stock of High quality Liquid Assets/Total Net
Cash Outflows over the Next 30 Calender Days)*100
227.21
122.77

395
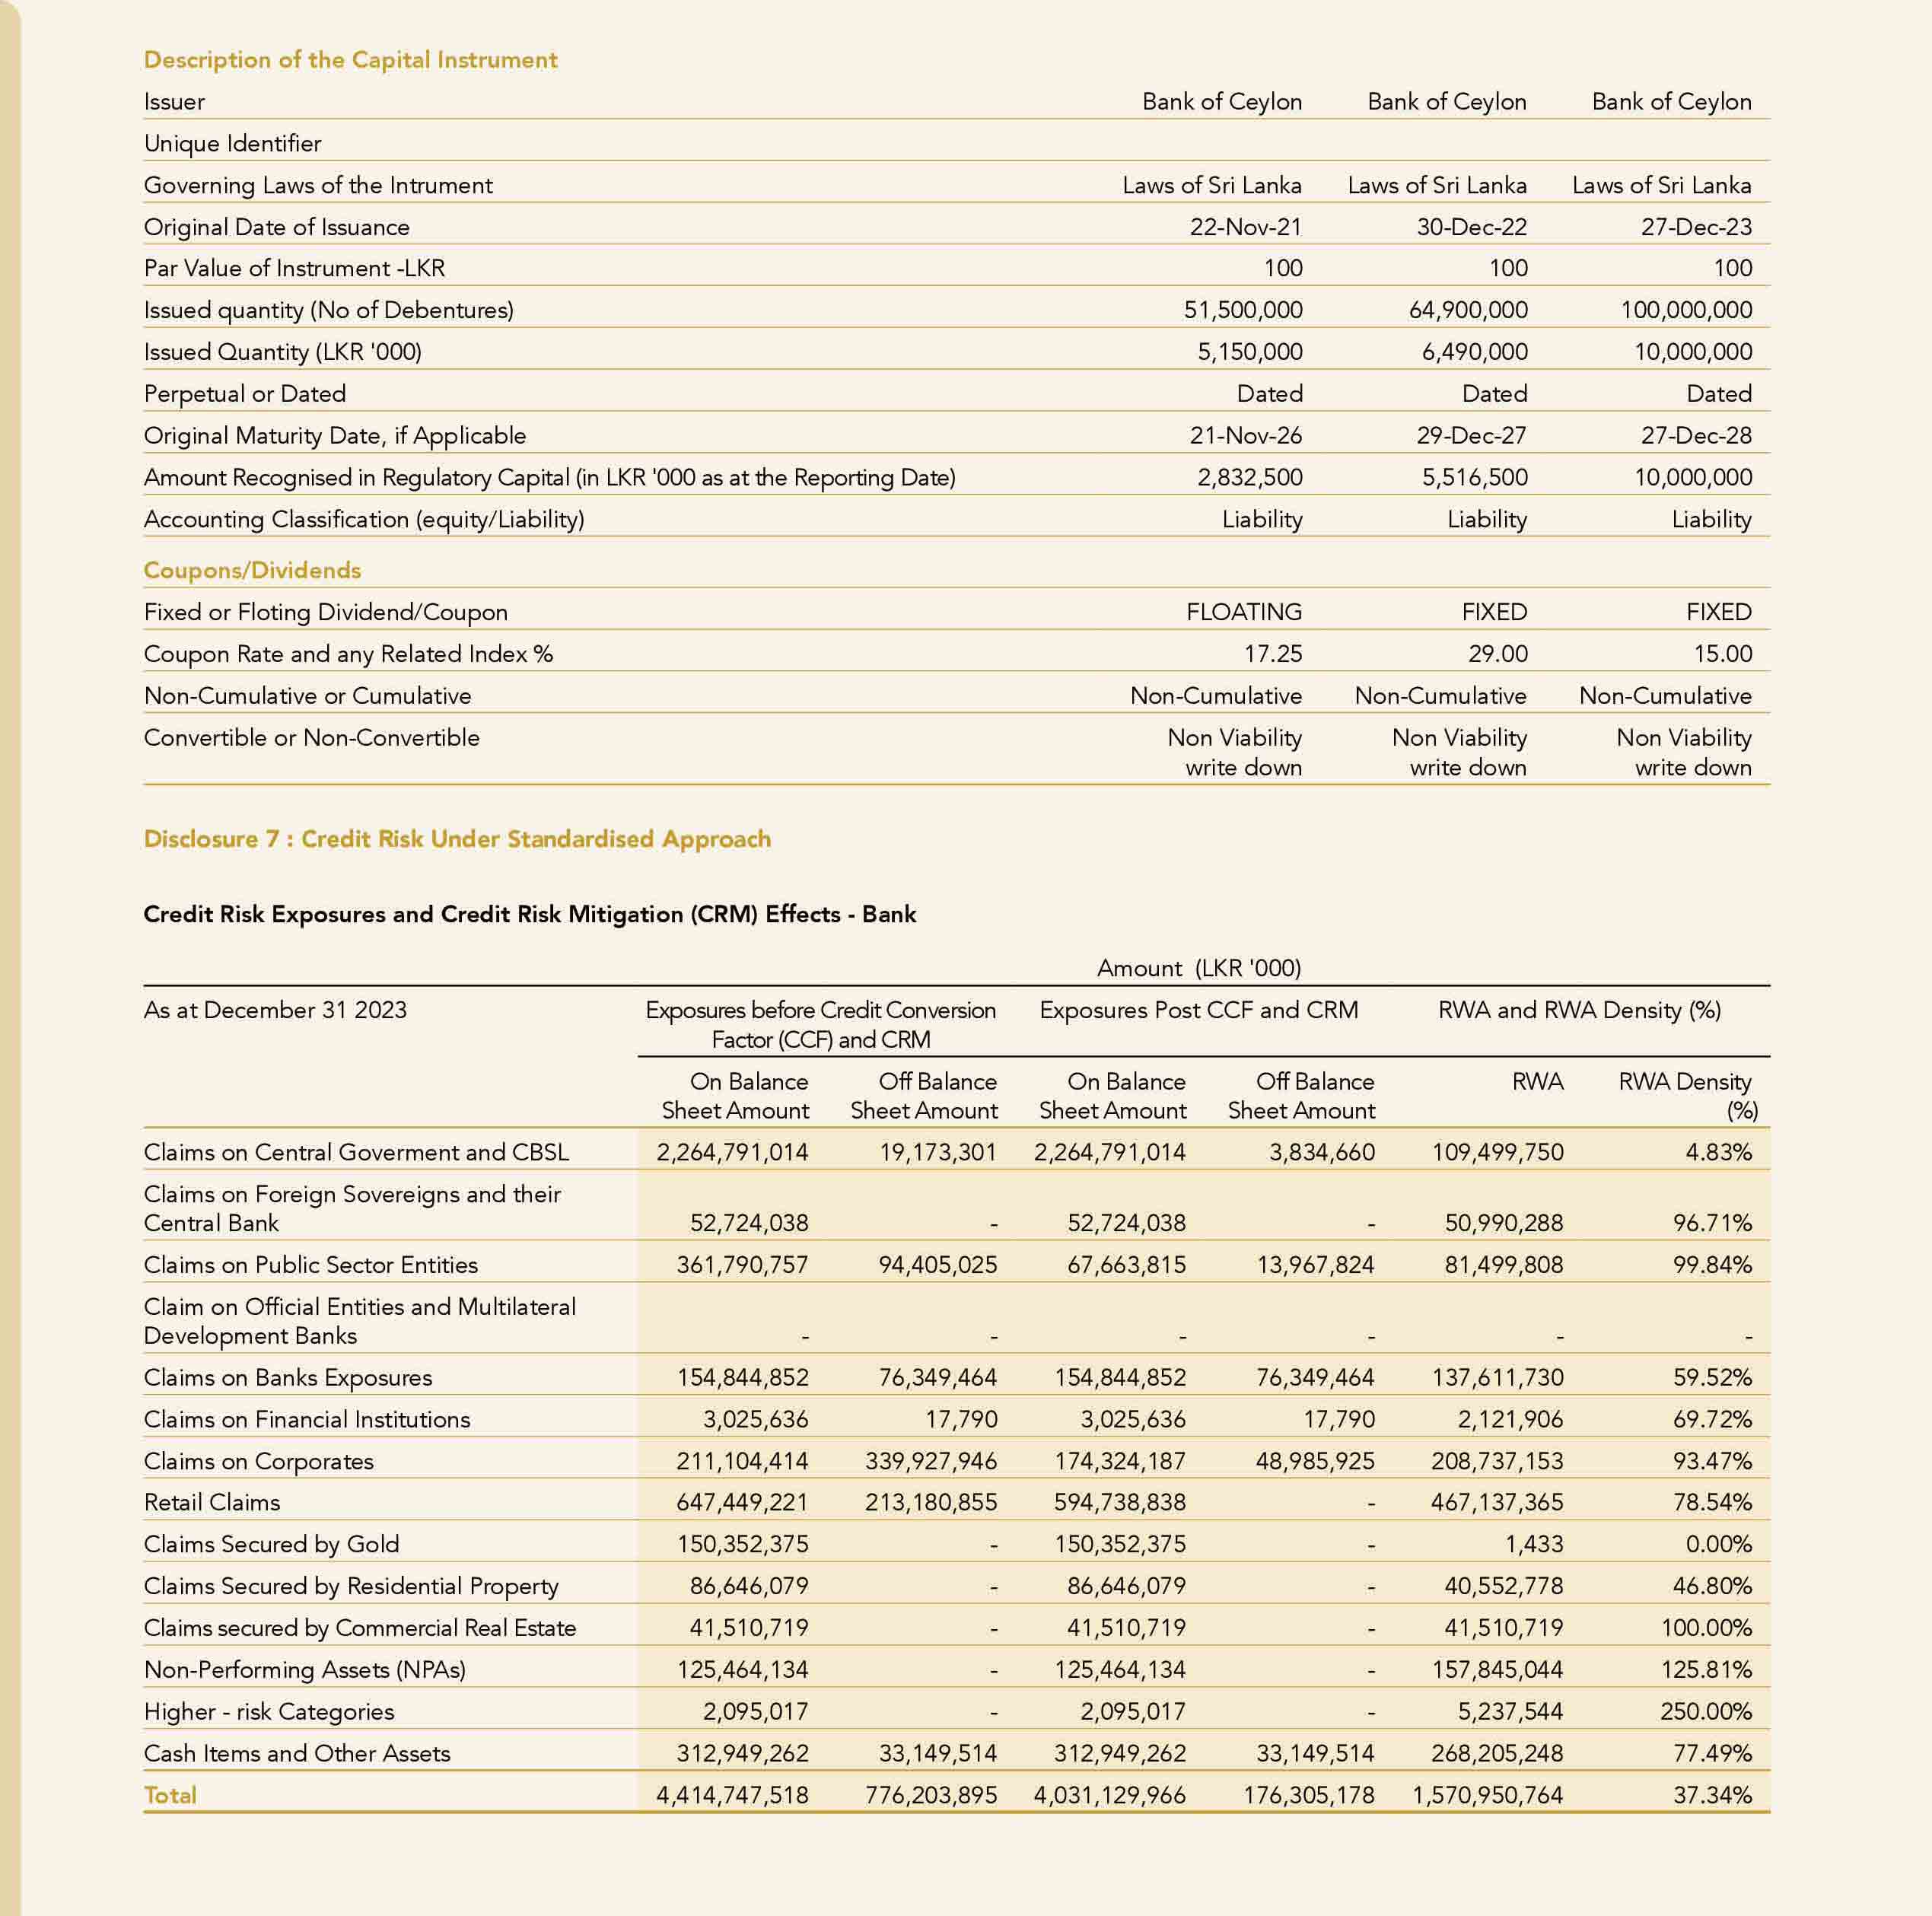
Disclosure 5 : Main Features of Regulatory Capital Instruments
Description of the Capital Instrument
Issuer
Bank of Ceylon
Bank of Ceylon
Bank of Ceylon
Bank of Ceylon
Bank of Ceylon
Unique Identifier
LK0357D23771
LK0357D23789
Governing Laws of the Intrument
Laws of Sri Lanka
Laws of Sri Lanka
Laws of Sri Lanka
Laws of Sri Lanka
Laws of Sri Lanka
Original Date of Issuance
29-Dec-16
29-Dec-16
29-Dec-17
31-Jul-18
27-Jun-19
Par Value of Instrument -LKR
100
100
100
100
100
Issued quantity (No of Debentures)
7,836
200
50,000,000
67,000,000
30,000,000
Issued Quantity (LKR '000)
784
20
5,000,000
6,700,000
3,000,000
Perpetual or Dated
Original Maturity Date, if Applicable
28-Dec-24
28-Dec-24
28-Dec-25
30-Jul-26
26-Jun-24
Amount Recognised in Regulatory Capital
(in LKR' 000 as at the Reporting Date)
118
3
1,750,000
3,350,000
150,000
Accounting Classification (Equity/Liability)
Liability
Liability
Liability
Liability
Liability
Coupons/Dividends
Fixed or Floting Dividend/Coupon
FIXED
FLOATING
FIXED
FIXED
FIXED
Coupon Rate and any Related Index %
12.75
15.41
12.75
12.00
11.75
Non-Cumulative or Cumulative
Non-Cumulative
Non-Cumulative
Non-Cumulative
Non-Cumulative
Non-Cumulative
Convertible or Non-Convertible
Non Convertible
Non Convertible
Non Convertible
Non Convertible
Non Convertible
Description of the Capital Instrument
Issuer
Bank of Ceylon
Bank of Ceylon
Bank of Ceylon
Bank of Ceylon
Bank of Ceylon
Unique Identifier
Governing Laws of the Intrument
Laws of Sri Lanka
Laws of Sri Lanka
Laws of Sri Lanka
Laws of Sri Lanka
Laws of Sri Lanka
Original Date of Issuance
17-Jul-19
18-Jul-19
23-Jul-19
24-Jul-19
26-Jul-19
Par Value of Instrument - LKR
100
100
100
100
100
Issued quantity (No of Debentures)
10,488,500
22,000,000
25,000,000
4,000,000
611,500
Issued Quantity (LKR '000)
1,048,850
2,200,000
2,500,000
400,000
61,150
Perpetual or Dated
Dated
Dated
Dated
Dated
Dated
Original Maturity Date, if Applicable
16-Jul-24
17-Jul-24
22-Jul-24
23-Jul-24
25-Jul-27
Amount Recognised in Regulatory Capital
(in LKR '000 as at the Reporting Date)
104,885
220,000
250,000
40,000
42,805
Accounting Classification (Equity/Liability)
Liability
Liability
Liability
Liability
Liability
Coupons/Dividends
Fixed or Floting Dividend/Coupon
FIXED
FIXED
FIXED
FIXED
FIXED
Coupon Rate and any Related Index %
11.80
11.80
11.80
11.50
11.75
Non-Cumulative or Cumulative
Non-Cumulative
Non-Cumulative
Non-Cumulative
Non-Cumulative
Non-Cumulative
Convertible or Non-Convertible
Non Viability
write down
Non Viability
write down
Non Viability
write down
Non Viability
write down
Non Viability
write down