
NOTES TO THE FINANCIAL STATEMENTS
1
Reporting Entity
1.1 Corporate information
Bank of Ceylon (“The Bank”) is a
Government-owned bank domiciled
in Sri Lanka, duly incorporated on 1
August 1939 under the Bank of Ceylon
Ordinance No. 53 of 1938. It is a licensed
commercial bank established under
the Banking Act No. 30 of 1988 and
amendments thereto. The Registered
Office of the Bank is situated at “BoC
Square”, No. 01, Bank of Ceylon
Mawatha, Colombo 01, Sri Lanka. The
debentures issued by the Bank are listed
on the Colombo Stock Exchange. The
staff strength of the Bank as at
31 December 2023 was 8,579 (2022- 8,209).
1.2 Consolidated financial statements
The Consolidated Financial Statements
are prepared as at and for the year
ended 31 December 2023 comprise
the Bank (“Parent”), its Subsidiaries
(together referred to as the “Group”
and individually as (“Group Entities”)
and the Group’s interests in its Associate
companies. The Financial Statements
of the companies in the Group have a
common financial year which ends on
31 December, except the Associate
companies, Transnational Lanka Records
Solutions (Private) Limited and Ceybank
Asset Management Limited. The Bank is
the ultimate parent of the Group.
1.3 Principal activities
1.3.1 Bank
The principal activities of the Bank
during the year were, personal banking,
corporate banking, development
banking, off-shore banking, trade
financing, lease financing, primary
dealing, investment banking and
wealth management, treasury
operations, correspondent banking and
money remittances, Islamic banking,
bancassurance, pawning, credit card
facilities, foreign currency operations and
other financial services.
1.3.2 Subsidiaries
The principal activities of the Subsidiaries of the Bank are as follows:
Name of the Company
Principal Business Activities
Property Development Limited Own, maintain and manage, develop and sustain the
utility and value of the Bank of Ceylon head office
building.
Merchant Bank of Sri Lanka &
Finance PLC
Leasing, hire purchase, corporate and retail credit
facilities, corporate advisory services, capital
market operations, margin trading, microfinancing,
agricultural credit facilities, real estate, pawning,
Islamic finance and accepting deposits.
Bank of Ceylon (UK) Limited
Authorised commercial bank by the Prudential
Regulation Authority and regulated by the Financial
Conduct Authority in England and Wales, engages
in retail and corporate banking, treasury operations,
correspondent banking services and trade financing
activities.
BoC Property Development &
Management (Private) Limited
Renting of office space of BoC Merchant Tower in
Colombo 03 and Ceybank House in Kandy.
BoC Travels (Private) Limited
Engages in travel related services.
Hotels Colombo (1963) Limited Provides hotel services.
Ceybank Holiday Homes
(Private) Limited
Managing, operating and maintaining of travel rests/
hotels/rest houses/guest houses.
MBSL Insurance Company
Limited
Carrying on insurance business, both life and non-life
insurance.
BoC Management & Support
Services (Private) Limited
Not in operation.
1.3.3 Associates
The principal activities of the Associates of the Bank are as follows:
Name of the Company
Principal Business Activities
Ceybank Asset Management
Limited
Management of unit trust funds and other institutional
and private portfolios.
Lanka Securities (Private)
Limited
Registered stock broker, trading in equity and
debt securities, equity debt security brokering and
undertaking placement of equity and debt securities.
Transnational Lanka Records
Solutions (Private) Limited
Renting buildings and hiring other assets.
Southern Development
Financial Company Limited
Not in operation and in the process of liquidation.
BoC Management & Support Services (Private) Limited (MSS) has not carried out its
core business activities since 2007. Southern Development Financial Company Limited
(SDFCL) is also not in operations. The Board of Directors of SDFCL has decided to
wind-up the company and it is in the process of liquidation.

2
Directors’ responsibility for
financial statements
2.1 Preparation and presentation of
the financial statements
The Board of Directors is responsible
for the preparation and presentation of
the Financial Statements of the Bank
and its Subsidiaries and Associates in
compliance with the requirements of
the Bank of Ceylon Ordinance No. 53
of 1938 and its amendments, Banking
Act No. 30 of 1988 and its amendments
thereto and Sri Lanka Accounting
Standards (SLFRSs and LKASs). These
Financial Statements comprise.
• Statement of Profit or Loss
• Statement of Comprehensive Income
• Statement of Financial Position
• Statement of Changes in Equity
• Statement of Cash Flows
• Notes to the Financial Statements
2.2 Approval of financial statements
The Financial Statements for the
year ended 31 December 2023 were
authorised for issue on 27 February 2024
by the Board of Directors.
3
Basis of preparation
3.1 Statement of compliance
The Consolidated Financial Statements
of the Group and the separate Financial
Statements of the Bank have been
prepared in accordance with Sri Lanka
Accounting Standards comprising Sri
Lanka Financial Reporting Standards
(SLFRSs) and Sri Lanka Accounting
Standards (LKASs) laid down by the
Institute of Chartered Accountants of Sri
Lanka (together referred to as SLFRSs in
these Financial Statements).
The preparation and presentation
of these Financial Statements are in
compliance with the requirements of
the Bank of Ceylon Ordinance No. 53 of
1938, the Banking Act No. 30 of 1988,
the Companies Act No. 07 of 2007 and
regulatory guidelines issued by the
Central Bank of Sri Lanka (CBSL). The
Group has prepared Financial Statements
which comply with SLFRSs applicable
for the year ended 31 December 2023,
together with the comparative year data
as at and for the year ended
31 December 2022, as described in the
accounting policies.
The formats used in the preparation and
presentation of the Financial Statements
and the disclosures made therein also
comply with the specified formats
prescribed by the Central Bank of Sri
Lanka (CBSL) in the Circular No. 02 of
2019 on “Publication of Annual and
Quarterly Financial Statements and Other
Disclosures by Licensed Banks”.
3.2 Basis of measurement
The Financial Statements have been
prepared on the basis of historical cost
convention and no adjustments have
been made for inflationary factors which
has been applied on a consistent basis,
except for the following:
• Derivative financial instruments are
measured at fair value (Notes 26
and 41)
• Financial assets recognised through
profit or loss – measured at fair value
(Note 27)
• Financial assets measured at fair
value through other comprehensive
income (Note 30)
• Owner-occupied freehold land
and buildings and buildings on
leasehold lands are measured at
revalued amount less any subsequent
accumulated depreciation and
impairment losses (Note 34)
• Defined benefit obligations are
actuarially valued and recognised
at the present value of the defined
benefit obligation less total of the fair
value of plan assets (Note 48)
• Cash flow hedge reserve, accounted
as per the hedge accounting (Note 53)
3.3 Presentation of financial
statements
Items in the Statement of Financial
Position of the Bank and the Group
are grouped by nature of such item
and presented broadly in order of their
relative liquidity and maturity pattern. An
analysis regarding recovery or settlement
within 12 months after the reporting
date (current) and more than 12 months
after the reporting date (non-current)
is presented in Note 60 – “Maturity
Analysis of Assets and Liabilities”.
3.3.1 Functional and presentation
currency
Items included in the Financial
Statements are measured and presented
in Sri Lankan Rupees (“LKR”) which is
the functional currency of the primary
economic environment in which the Bank
operates.
3.3.2 Accrual basis of accounting
The Financial Statements, except for
information on Statement of Cash Flows
have been prepared following the accrual
basis of accounting.
3.3.3 Offsetting
Financial assets and financial liabilities are
generally reported gross in the Statement
of Financial Position. They are only offset
and reported net when, in addition
to having an unconditional legally
enforceable right to offset the recognised
amounts without being contingent on a
future event, the parties also intend to
settle on a net basis in all of the following
circumstances:
• The normal course of business.
• The event of default.
• The event of insolvency or bankruptcy
of the Bank/Group and/or its
counterparties.
Income and expenses are not offset in
the Statement of Profit or Loss unless
required or permitted by any accounting
standard or interpretation and as

specifically disclosed in the accounting
policies of the Group.
3.3.4 Comparative information
The comparative information is provided
in narrative and descriptive nature,
if it is relevant to understand the
current period’s Financial Statements
and reclassified wherever necessary
to conform to the current year’s
presentation.
3.3.5 Materiality and aggregation
In compliance with LKAS 1 –
“Presentation of Financial Statements”,
each material class of similar items are
presented separately in the Financial
Statements. Items of dissimilar nature or
functions are presented separately unless
they are immaterial.
3.3.6 Rounding
The amounts in the Financial Statements
have been rounded-off to the nearest
Rupees thousands, except where otherwise
indicated as permitted by the LKAS 1 –
“Presentation of Financial Statements”.
3.3.7 Statement of cash flows
The Statement of Cash Flows is prepared
by using the “Indirect Method”
in accordance with the LKAS 7 –
“Statement of Cash Flows” whereby the
profit is adjusted to derive the cash flows
from operating activities. Cash and cash
equivalents comprise cash in hand, other
short term highly liquid investments with
maturity less than seven days from date
of acquisition and bank overdrafts.
3.3.8 Use of material accounting
judgements, estimates and
assumptions
The preparation of the Financial
Statements requires Management to
exercise judgements, estimates and
assumptions that affect the application
of accounting policies and the reported
amounts of assets, liabilities, income
and expenses. Actual results may differ
from these estimates. The judgements,
estimates and assumptions are based
on historical experience and various
other factors that are believed to be
reasonable under the circumstances and
reviewed on an ongoing basis. Revisions
to accounting estimates are recognised
in the period in which the estimates
are revised and/or in future periods if
the revision affects future periods too.
In the process of applying the Group’s
accounting policies, Management
has made the following judgements,
estimates and assumptions, which
have the most significant effect on the
amounts recognised in the Financial
Statements. The accounting policies
which are most sensitive to the use of
judgements, estimates and assumptions
are specified below.
3.3.8.1 Going concern
The Management has made an
assessment on the Group’s ability to
continue as a going concern and is
satisfied that it has the resources to
continue in business for the foreseeable
future. Furthermore, management is
not aware of any material uncertainties
that may cast significant doubt upon
the Group’s ability to continue as a
going concern. Therefore, the Financial
Statements continue to be prepared on
the going concern basis. Accordingly,
the Management satisfied itself that the
going concern basis is appropriate.
3.3.8.2 Commitment and contingent
liabilities
All discernible risks are accounted for
in determining the amount of all known
and measurable liabilities. Contingent
liabilities are possible obligations
whose existence will be confirmed
only by uncertain future events or
present obligations where the transfer
of economic benefit is not probable or
cannot be reliably measured. Contingent
liabilities are not recognised in the
Statement of Financial Position but are
disclosed unless its considered remote
that the Group will be liable to settle the
possible obligation.
3.3.8.3 Fair value of financial
instruments
Fair value is the price that would
be received to sell an asset or paid
to transfer a liability in an orderly
transaction between market participants
at the measurement date. Where the
classification of a financial asset or
liability results in it being measured
at fair value, wherever possible, the
fair value is determined by reference
to the quoted bid or offer price in
the most advantageous active market
to which the Group has immediate
access. An adjustment for credit risk is
also incorporated into the fair value as
appropriate. Fair value for a net open
position that is a financial liability quoted
in an active market is the current offer
price, and for a financial asset the bid
price, multiplied by the number of units
of the instrument held or issued. Where
no active market exists for a particular
asset or liability, the Group uses a
valuation technique that include the
use of mathematical models to arrive
at the fair value, including the use of
transaction prices obtained in recent
arm’s length transactions, discounted
cash flow analysis, option pricing models
and other valuation techniques based
on market conditions and risks existing
at reporting date. In doing so, fair value
is estimated using a valuation technique
that makes maximum use of observable
market inputs and places minimal
reliance upon entity-specific inputs.
The best evidence of the fair value of a
financial instrument at initial recognition
is the transaction price (i.e. the fair value
of the consideration given or received)
unless the fair value of that instrument
is evidenced by comparison with other
observable current market transactions
in the same instrument (i.e. without
modification or repackaging) or based
on a valuation technique whose variables
include only data from observable
markets. When such evidence exists, the
Group recognises the difference between
the transaction price and the fair value
in profit or loss on initial recognition

(i.e. on day one). The valuations of
financial instruments are described
comprehensively in Note 63.
3.3.8.4 Impairment charge for loans
and advances
The measurement of impairment charge
under SLFRS 9- “Financial Instruments”
requires judgement by Management
in identification and estimation of the
amount and timing of future cash flows
when determining an impairment charge
for loans and advances. Accordingly, the
Group reviews its individually significant
loans and advances at each reporting
date to assess whether an impairment
charge should be provided in the
Statement of Profit or Loss. In particular,
the Management’s judgement is required
in identification and estimation of the
amount and timing of future cash flows
when determining the impairment loss.
In estimating these cash flows, the Group
makes judgements about the borrower’s
financial position, the net realisable
value of collateral and other related
factors. These estimates are based on
assumptions about a number of factors
and actual results may differ, resulting
in future changes to the impairment
allowance. A collective impairment
provision is established for the groups of
homogeneous loans and advances that
are not considered individually significant
and groups of loans that are individually
significant but that were not found to
be individually impaired. A collective
assessment of impairment takes into
account the data from loan portfolio
(such as credit quality, levels of arrears,
credit utilisation, etc.), concentrations
of risk and economic data (including
levels of unemployment, inflation, GDP
growth rate and country rating) and
the performance of different individual
group. The impairment requirements in
SLFRS 9 – “Financial Instruments” are
based on an expected credit loss (ECL)
model and it is reflected the general
pattern of deterioration or improvement,
in the credit quality of financial
instruments. The Group calculates ECLs
either on a collective or an individual
basis. The amount of ECLs recognised as
a loss allowance or provision depends on
the extent of credit deterioration since
initial recognition and measured under
following bases:
• 12-month ECLs (Stage 1), which apply
to all items as long as there is no
significant deterioration in credit risk.
• Lifetime ECLs (Stages 2 and 3), which
apply when a significant increase
in credit risk has occurred on an
individual or collective basis.
Further, the Group makes additional
judgements and estimates with regard to
the following under ECL model.
• The Group’s criteria for assessing if
there has been a significant increase
in credit risk and so impairment for
financial assets should be measured
on a lifetime ECL basis.
• Development of ECL models,
including various formula and the
choice of inputs.
• Determination of association between
macroeconomic inputs, such as
GDP growth, inflation, interest rates,
exchange rates and unemployment
with the effect on probability of
default (PDs), exposure at default
(EAD) and loss given default (LGD).
• Selection of forward-looking
macroeconomic scenarios and their
probability weightings to derive the
economic inputs into the ECL model.
The economic scenarios and forward-
looking macroeconomic assumptions
underpinning the collective provision
calculation are outlined in Note 4.4.11.
As per SLFRS 9 – “Financial Instruments”,
the collective provision for groups of
homogeneous loans is established
using statistical methods or, a formula
approach based on historical loss rate
experience, using the statistical analysis
of historical data on delinquency
to estimate the amount of loss.
Management applies judgement to
ensure that the estimate of loss arrived
at, on the basis of historical information
is appropriately adjusted to reflect the
economic conditions and portfolio factors
as at the reporting date. The loss rates
are regularly reviewed against, actual
loss experience. It has been the Group’s
policy to regularly review its model in
the context of actual loss experience
and adjust when necessary. The accuracy
of the provision depends on the model
assumptions and parameters used in
determining the impairment. Details of
impairment losses on loans and advances
are given in Note 14.
3.3.8.5 Impairment of investment in
subsidiaries, other financial assets
and non-financial assets
The Group and the Bank follow the
guidance of LKAS 36 – “Impairment
of Assets” and SLFRS 9 – “Financial
Instruments” in determining whether
an investment or a financial asset
is impaired. Determination and
identification of impairment indicators
require the Group and the Bank to
evaluate duration and extent to which
the fair value of an investment for a
financial asset is less than its cost and
the financial stability of the near term
business outlook of the investment or the
financial asset, considering the factors
such as performance of the sector and
industry, technology and operational
environmental changes along with future
cash flows. This process involves with
material judgement in aforesaid areas.
3.3.8.6 Defined benefit obligation
The cost of the defined benefit pension
plans and other post- employment
benefit plans are determined using an
actuarial valuation. An actuarial valuation
involves making various assumptions
determining the discount rates, expected
rates of return on planned assets, future
salary increases, mortality rates and future
pension increases. Due to the long-term
nature of these plans, such estimates
are subject to significant uncertainty. In
determining the appropriate discount

rate, the Group considers the interest
rates of Sri Lanka Government Bonds
with maturities corresponding to the
expected duration of the Defined Benefit
Obligation. The mortality rate is based
on publicly available mortality tables.
Future salary increases and pension
increases are based on inflation rate
and salary increase rates of the Group.
All assumptions are reviewed at each
reporting date and assumptions used in
the year are given in Note 48.
3.3.8.7 Fair value of land and
buildings
The freehold land and buildings and
the buildings on leasehold land of
the Group are reflected at fair value
less accumulated depreciation. The
Group engaged independent valuation
specialists to determine fair value of such
properties in terms of the SLFRS 13 –
“Fair Value Measurement”. The details of
valuation of freehold land and buildings
and the buildings on leasehold land are
given in Note 34.
3.3.8.8 Useful life of the property,
plant and equipment and intangible
assets
The Group reviews the residual values,
useful lives and methods of depreciation
of property, plant and equipment and
intangible assets at each reporting
date. Judgement of the Management
is exercised in the estimation of these
values, rates, methods and hence they
are subject to uncertainty. The details
of the depreciation methods and rates
used for each assets category are given
in Note 34.
3.3.8.9 Classification of investment
properties
Management is required to use its
judgement to determine whether a
property qualified as an investment
property. A property that is held to earn
rentals or for capital appreciation or
both and which generates cash flows
largely independently of the other
assets held by the Group are accounted
for as investment properties. On the
other hand, properties that are used for
operations or for the process of providing
services or for administration purposes
and which do not directly generate
cash flows as stand- alone assets are
accounted as property, plant and
equipment.
3.3.8.10 Determination of control
over investees
Subsidiaries are entities that are
controlled by the Bank, control is
achieved when the Bank is exposed,
or has rights to variable returns from
its involvement with the invitee and
has the ability to affect the returns of
those investees through its power over
the investee. The Management applies
its judgements to determine the Bank
controls over its investees.
3.3.8.11 Taxation
The Group is subject to income tax, value
added tax (VAT) and other applicable
taxes. A judgement is required to
determine the total provision for current,
deferred and other taxes due to the
uncertainties that exists with respect
to the interpretation of the applicable
tax laws at the time of preparing these
Financial Statements. The details on
the applicable tax rates and other
information are given under Notes
4.8, 18, and 37. The Group is subject
to transfer pricing regulations and it
is necessitated using management
judgement to determine the impact of
transfer pricing regulations. Accordingly,
critical judgements and estimates were
used in applying the regulations in
aspects including but not limited to
identifying associated undertakings,
estimation of the respective arm’s length
prices and selection of appropriate
pricing mechanism. The current tax
charge is subject to such judgements.
Differences between estimated income
tax charge and actual payable may
arise as a result of variances between
Management’s interpretation and
application of tax regulation.
4
Material accounting
policies
The material accounting policies applied
by the Bank and the Group in preparation
of its Financial Statements are included
below and have been consistently
applied to all periods presented in the
Financial Statements of the Group and
the Bank, unless otherwise indicated.
4.1 Basis of consolidation
The Group’s Financial Statements
comprise consolidation of the Financial
Statements of the Bank and its
Subsidiaries in terms of SLFRS 10 –
“Consolidated Financial Statements”
and LKAS 27 – “Consolidated and
Separate Financial Statements” and the
proportionate share of the profit or loss
and net assets of its Associates in terms
of the Sri Lanka Accounting Standard
LKAS 28 – “Investments in Associates
and Joint Ventures”. The Bank’s Financial
Statements comprise the amalgamation of
the Financial Statements of the Domestic
Banking Unit, the Off-shore Banking Unit
and the Overseas Operations of the Bank.
The detailed accounting policies pertaining
to the consolidation of subsidiaries and
associates are given in the Notes 31 and
32.
4.1.1 Business combinations
The Group determines whether a
transaction or other event is a business
combination by applying the definition
in SLFRS 3 – “Business Combinations”,
which requires that the assets acquired
and liabilities assumed constitute a
business. Business combinations are
accounted for using the acquisition
method. As of the acquisition date, the
amount of non-controlling interest is
measured either at fair value or at the
non-controlling interests’ proportionate
share of the acquirer’s identifiable net
assets. Acquisition related cost are
costs the acquirer incurs to effect a
business combination. Those costs
include finder’s fees, advisory, legal,
accounting, valuation, other professional

consulting fees, general administrative
costs including the cost of maintaining
an Internal Acquisition Department and
cost of registering and issuing debt and
equity securities. Acquisition related
costs, other than those associated with
the issue of debt or equity securities
are expensed in the periods in which
the costs are incurred and the services
are received. The Group elects on a
transaction by transaction basis whether
to measure non-controlling interests
at its fair value or at its proportionate
share of the recognised amount of the
identifiable net assets, at the acquisition
date. Transaction costs, other than those
associated with the issue of debt or
equity securities that the Group incurs in
connection with a business combination
are expensed as incurred.
4.1.2 Loss of control
When the Group loses control over a
subsidiary, it derecognises the assets
and liabilities of the subsidiary, and any
related non-controlling interest (NCI)
and other components of equity. Any
resulting gain or loss is recognised in
profit or loss. Any interest retained in
the former subsidiary is measured at fair
value when control is lost. Further, the
Bank’s share of components previously
recognised in Other Comprehensive
Income (OCI) is reclassified to profit or
loss or retained earnings as appropriate.
Any surplus or deficit arising on the loss
of control is recognised in the profit or
loss. If the Group retains any interest
in the previous subsidiary, then such
interest is measured at fair value at the
date that control is lost. Subsequently, it
is accounted for as an equity-accounted
investee or in accordance with the
Group’s accounting policy for financial
instruments depending on the level of
influence retained.
4.2 Foreign currency translations
4.2.1 Foreign currency transactions
and balances
At the initial recognition, transactions
in foreign currency are translated
into the functional currency of the
operation which is Sri Lankan Rupees
(LKR) at the spot exchange rate at
the date of the transaction. Monetary
assets and liabilities denominated in
foreign currency at the reporting date
are retranslated into the functional
currency at the spot exchange rate at
that date and all differences arising
on non-trading activities are taken to
“Net other operating income” (Note
13) in the Statement of Profit or Loss.
Non-monetary assets and liabilities
that are measured in terms of historical
cost in a foreign currency are translated
using the exchange rate at the date of
the initial recognition. Non-monetary
assets and liabilities denominated in
foreign currency that are measured
at fair value are retranslated into the
functional currency at the spot exchange
rate including any exchange gain or
loss component at the date on which
the fair value is determined. Gain or
loss on a non-monetary item including
exchange component is recognised
in Other Comprehensive Income.
Forward exchange contracts are valued
at the forward market rates ruling on
the reporting date and resulting net
unrealised gains or losses are dealt within
the Statement of Profit or Loss.
4.2.2 Foreign operations
The results and financial position of
foreign operations, whose functional
currencies are not Sri Lankan Rupees,
are translated into Sri Lankan Rupees as
follows:
The assets and liabilities of foreign
operations are translated into Sri Lankan
Rupees at spot exchange rate as at the
reporting date.
The income and expenses of foreign
operations are translated at average
rate for the period. Foreign currency
differences on the translation of foreign
operations are recognised in Other
Comprehensive Income.
When a foreign operation is disposed
off, the relevant amount in the translation
reserve is transferred to the profit or loss
as part of the profit or loss on disposal
in other operating income or other
operating expenses.
4.2.3 Hedge accounting
The Bank enters into hedging
arrangements with the counterparties in
order to mitigate the foreign exchange
risk from foreign currency transactions.
According to the SLFRS 9 - "Financial
Instrument", an entity may designate an
item in its entirety or a component of an
item as the hedged item in a hedging
relationship. A hedging relationship
qualifies for hedge accounting only if
the hedging relationship consists only of
eligible hedging instruments and eligible
hedged items.
At the inception of the hedging
relationship there is formal designation
and documentation of the hedging
relationship and the entity’s risk
management objective and strategy
for undertaking the hedge. That
documentation shall include
identification of the hedging instrument,
the hedged item, the nature of the risk
being hedged and how the entity will
assess whether the hedging relationship
meets the hedge effectiveness
requirements, including its analysis of
the sources of hedge ineffectiveness and
how it determines the hedge ratio.
SLFRS 9 – “Financial Instruments”
enables hedge accounting for three
different designated categories, namely
cash flow hedge (designated for a highly
probable forecasted transaction, a
firm commitment (not recorded on the
balance sheet), foreign currency cash
flows of a recognised asset or liability, or
a forecasted intercompany transaction).
Fair value hedge (designated for a firm
commitment (not recorded) or foreign
currency cash flows of a recognised
asset or liability). Net investment hedge
(designated for the net investment in a
foreign operation). The Bank accounts
the similar transactions, under hedge
accounting treatment specified in the
SLFRS 9 – “Financial Instruments” and
were valued using forward exchange
rates as of each reporting date of such
instruments.
4.3 Classification of financial
instruments between debt and
equity
Classification of financial instruments
between debt and equity depends
on following characteristics of such
instruments:
• Name or labels given to the
instruments
• Presence or absence of a fixed
maturity date
• Life of the instrument
• Source of payments
• Right to enforce payments
• Rights to participate in Management
• Risk involved in the instruments
• Volatility of cash flows
• Securities given as collaterals
4.4 Financial assets and financial
liabilities
4.4.1 Recognition and derecognition
of financial instruments
All financial assets and liabilities are
initially recognised on the settlement
date, i.e. the date that the Group
becomes a party to the contractual
provisions of the instrument. This
includes; “regular way trades”. Regular
way trade means purchases or sales of
financial assets that require delivery of
assets within the time frame generally
established by regulation or convention
in the market place. Loans and
receivables are recognised when cash is
advanced (or settled) to the borrowers.
Financial assets at fair value through
profit or loss are recognised initially at
fair value. All other financial assets are
recognised initially at fair value plus
directly attributable transaction costs.
The Group derecognises a financial asset
when the contractual cash flows from
the asset expire or it transfers its rights
to receive contractual cash flows on the
financial asset in a transaction in which
substantially all the risks and rewards of
ownership are transferred. Any interest in
transferred financial assets that is created
or retained by the Group is recognised as
a separate asset or liability.
A financial liability is derecognised
when the obligation under the liability
is discharged or cancelled or expired.
Where an existing financial liability is
replaced by another from the same
lender on substantially different terms,
or the terms of an existing liability
are substantially modified, such an
exchange or modification is treated as
a derecognition of the original liability
and the recognition of a new liability. The
difference between the carrying value
of the original financial liability and the
consideration paid is recognised in the
Statement of Profit or Loss.
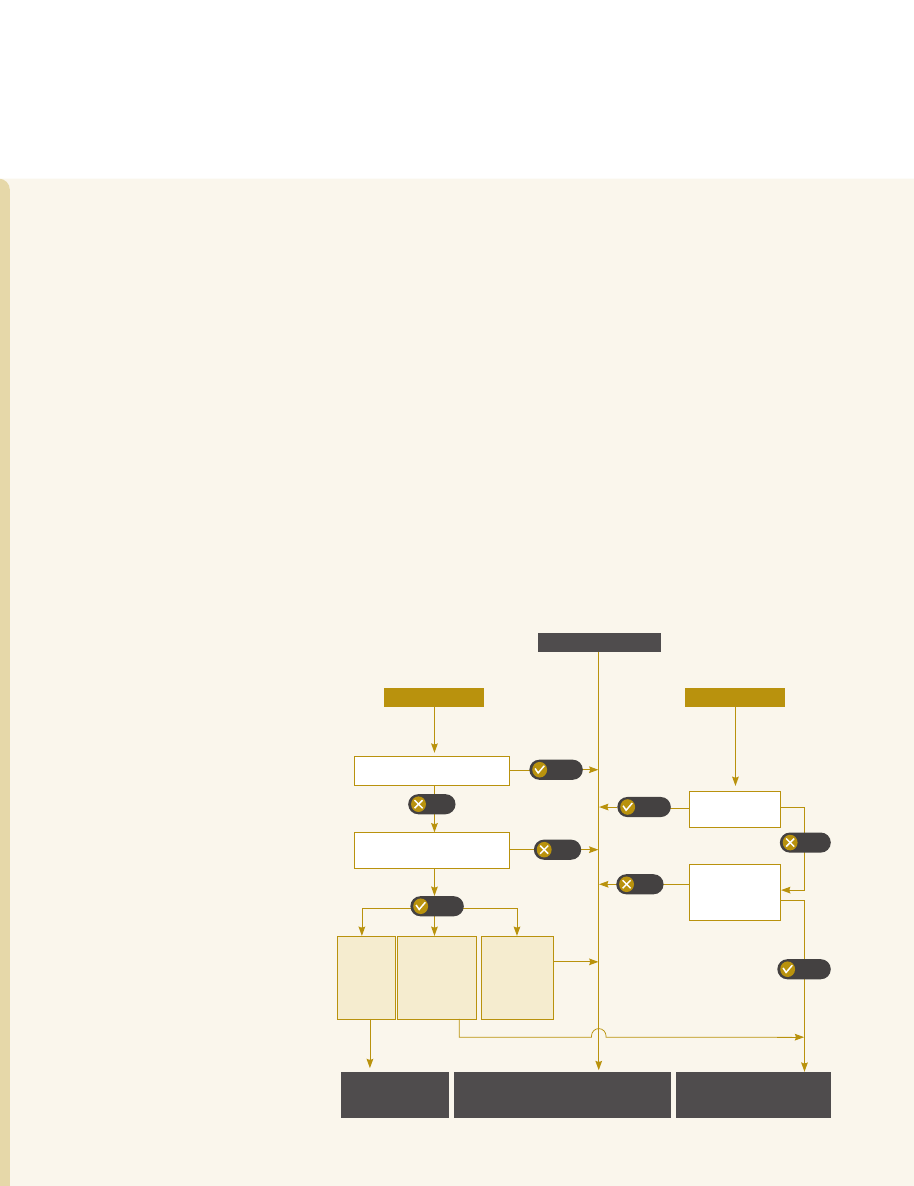
Solely Payments of Principle
and Interest (SPPI)?
Fair value option elected?
Derivative Instrument
Debt Instrument
Held for trading
Elected the
irrecoverable
option of OCI?
Amortised cost
Fair value through other
comprehensive income
Equity instrument
Yes
Yes
Yes
Yes
No
No
No
No
Fair value through profit or loss
Held for
Trading
Held to
collect cash
flows and
for sale
Held to
collect
cash flow
4.4.2 Classification of financial assets and financial liabilities
As per SLFRS 9 – “Financial Instruments”, the classification depends on the Group’s
business model for managing financial assets and the contractual terms of the financial
assets’ cash flows. The following diagram depicts how the Bank classifies the financial
assets.

4.4.2.1 At the inception, the financial
assets are classified in one of the
following categories
• Financial assets measured at fair
value through profit or loss (Notes
4.4.7 and 27)
• Financial assets at amortised cost
– Financial assets at amortised cost
– loans and advances (Note 28)
– Financial assets at amortised
cost - debt and other instruments
(Notes 4.4.8 and 29)
• Financial assets measured at fair
value through other comprehensive
income (Notes 4.4.9 and 30).
4.4.2.2 At the inception, the financial
liabilities are classified in one of the
following categories
• Financial liabilities at amortised cost
– Financial liabilities at amortised
cost – due to depositors (Note 42)
– Financial liabilities at amortised
cost – other borrowings and
subordinated liabilities (Notes 43
and 49)
4.4.3 Initial measurements of financial
instruments
Financial assets and liabilities are
initially measured at their fair value
plus transaction cost, except in the
case of financial assets and liabilities
recorded at fair value through profit
or loss. Transaction cost in relation to
financial assets and liabilities at fair value
through profit or loss are dealt with in the
Statement of Profit or Loss.
4.4.4 “Day One” profit or loss
When the transaction price differs
from the fair value of other observable
current market transactions in the same
instrument or based on a valuation
technique whose variables include only
data from observable markets, the Group
immediately recognises the difference
between the transaction price and fair
value (a “Day One” profit or loss) in the
Statement of Profit or Loss. In cases
where fair value is determined using data
which is not observable, the difference
between the transaction price and model
value is only recognised in the Statement
of Profit or Loss over the life of the
instrument.
4.4.5 Business model assessment
With effect from 1 January 2018, as per
SLFRS 9 – “Financial Instrument”, the
Group classifies all of its financial assets
based on the business model and makes
an assessment of the objective of a
business model in which an asset is held
at a portfolio level and not assessed on
instrument by – instrument basis because
this best reflects the way the business is
managed and information is provided
to management. The information
considered includes:
• The stated policies and objectives
for the portfolio and the operation
of those policies in practice. In
particular, whether Management’s
strategy focuses on earning
contractual interest revenue,
maintaining a particular interest rate
profile, matching the duration of the
financial assets to the duration of
the liabilities that are funding those
assets or realising cash flows through
the sale of the assets;
• How the performance of the portfolio
is evaluated and reported to the
Bank’s management;
• The risks that affect the performance
of the business model (and the
financial assets held within that
business model) and how those risks
are managed;
• How managers of the business
are compensated – e.g. whether
compensation is based on the fair
value of the assets managed or the
contractual cash flows collected; and
• The frequency, volume and timing
of sales in prior periods, the reasons
for such sales and its expectations
about future sales activity. However,
information about sales activity is not
considered in isolation, but as part
of an overall assessment of how the
Bank’s stated objective for managing
the financial assets is achieved and
how cash flows are realised.
The business model assessment is
based on reasonably expected scenarios
without taking “worst case” or “stress
case” scenarios into account. If cash
flows after initial recognition are realised
in a way that is different from the Bank’s
original expectations, the Bank does not
change the classification of the remaining
financial assets held in that business
model, but incorporates such information
when assessing newly originated or newly
purchased financial assets going forward.
4.4.6 Assessment of whether
contractual cash flow characteristics
are met the Solely Payments of Prin-
cipal and Interest (SPPI test)
As a second step of assets classification
process, the Group assesses the
contractual terms of financial assets to
identify whether they meet the SPPI test.
For the purposes of this assessment,
“principal” is defined as the fair value of
the financial asset on initial recognition
and may change over the life of the
financial asset (for example, if there are
repayments of principal or amortisation
of the premium/discount).
“Interest” is defined as consideration
for the time value of money and for the
credit risk associated with the principal
amount outstanding during a particular
period of time and for other basic
lending risks and costs, as well as profit
margin.
In contrast, contractual terms that
introduce a more than de minimise
exposure to risks or volatility in the
contractual cash flows that are unrelated
to a basic lending arrangement do
not give rise to contractual cash flows

that are solely payments of principal
and interest on the principal amount
outstanding. In such cases, the financial
asset is required to be measured at fair
value through profit and loss.
In assessing whether the contractual cash
flows are solely payments of principal
and interest on principal amount
outstanding, the Group considers the
contractual terms of the instrument. This
includes assessing whether the financial
asset contains a contractual term that
could change the timing or amount of
contractual cash flows such that it would
not meet this condition. In making the
assessment, the Group considers:
• Contingent events that would change
the amount and timing of cash flows
• Leverage features;
• Prepayment and extension terms;
• Terms that limit the Group’s claim to
cash flows from specified assets; and
• Features that modify consideration of
the time value of money
4.4.7 Financial assets measured at
fair value through profit or loss
Items at fair value through profit or loss
comprise:
• Items held for trading purpose;
• Items specifically designated as fair
value through profit or loss on initial
recognition; and
• Debt instruments with contractual
terms that do not represent solely
payments of principal and interest.
Financial instruments held at fair
value through profit or loss are initially
recognised at fair value, with transaction
costs recognised in the Statement of
Profit or Loss as incurred. Subsequently,
they are measured at fair value and any
gains or losses are recognised in the
Statement of Profit or Loss as they arise.
Where a financial asset is measured at
fair value, a credit valuation adjustment is
included to reflect the credit worthiness
of the counterparty, representing the
movement in fair value attributable to
changes in credit risk.
4.4.7.1 Financial instruments held for
trading purpose
A financial instrument is classified as
held for trading if it is acquired or
incurred principally for the purpose of
selling or repurchasing in the near term,
or forms part of a portfolio of financial
instruments that are managed together
and for which there is evidence of short-
term profit taking, or it is a derivative
not in a qualifying hedge relationship.
Trading derivatives and trading securities
are classified as held for trading and
recognised at fair value in the Statement
of Financial Position. Changes in fair
value are recognised in “Net gains/
(losses) from trading” (Note 10) and “Net
fair value gains/(losses) from financial
instruments at fair value through profit
or loss” (Note 11). Interest income from
financial instruments held for trading is
recorded under “Net interest income”
(Note 8) while dividend income is
recorded in “Net gains/(losses) from
trading” (Note 10) when the right to
payment has been established.
4.4.7.2 Financial instruments
designated and measured at fair
value through profit or loss
Upon initial recognition, financial
instruments may be designated and
measured at fair value through profit
or loss. A financial asset may only be
designated at fair value through profit or
loss if doing so eliminates or significantly
reduces measurement or recognition
inconsistencies (i.e. eliminates an
accounting mismatch) that would
otherwise arise from measuring financial
assets or liabilities on a different basis.
A financial liability may be designated
at fair value through profit or loss if it
eliminates or significantly reduces an
accounting mismatch or:
• If a host contract contains one or
more embedded derivatives; or
• If financial assets and liabilities are
both managed and their performance
evaluated on a fair value basis in
accordance with a documented
risk management or investment
strategy. Where a financial liability is
designated at fair value through profit
or loss, the movement in fair value
attributable to changes in the Group’s
own credit quality is calculated by
determining the changes in credit
spreads above observable market
interest rates and is presented
separately in other comprehensive
income. As of 31 December 2023,
there were no any financial liability
designated at fair value through profit
or loss.
4.4.7.3 Debt instruments with
contractual terms that do not
represent the solely payments of
principal and interest
Financial debt instruments which are not
meet solely payments of principal and
interest test will be classified as fair value
through profit or loss.
4.4.8 Financial assets measured at
amortised cost-debt instruments
Investments in debt instruments are
measured at amortised cost where they
have:
• Contractual terms that give rise to
cash flows on specified dates, that
represent solely payments of principal
and interest on the principal amount
outstanding; and
• Are held within a business model
whose objective is achieved by
holding to collect contractual cash
flows.
These debt instruments are initially
recognised at fair value plus directly
attributable transaction costs and
subsequently measured at amortised
cost using effective interest rate (EIR).
The measurement of credit impairment is
based on the three stage expected credit
loss model described below in Note
4.4.11 Impairment of financial assets.

4.4.9 Financial assets measured at fair
value through other comprehensive
income
4.4.9.1 Debt instruments
Investments in debt instruments are
measured at fair value through other
comprehensive income where they have:
• Contractual terms that give rise to
cash flows on specified dates, that
represent solely payments of principal
and interest on the principal amount
outstanding; and
• Are held within a business model
whose objective is achieved by both
collecting contractual cash flows and
selling financial assets.
These debt instruments are initially
recognised at fair value plus directly
attributable transaction costs and
subsequently measured at fair value.
Gains and losses arising from changes
in fair value are included in Other
Comprehensive Income within a separate
component of equity. Impairment losses
or reversals, interest revenue and foreign
exchange gains and losses are recognised
in profit or loss. Upon disposal, the
cumulative gain or loss previously
recognised in other comprehensive
income is reclassified from other
comprehensive income to profit or loss.
The measurement of credit impairment is
based on the three stage expected credit
loss model as applied to financial assets at
amortised cost. The expected credit loss
model is described below in Note 4.4.11
Impairment of financial assets.
4.4.9.2 Equity instruments
Investment in equity instruments that are
neither held for trading nor contingent
consideration recognised by the Group in
a business combination to which SLFRS
3 – “Business Combinations” applies,
are measured at fair value through
other comprehensive income, where
an irrevocable election has been made
by management. For portfolios where
management does not consider an
irrevocable election of adopting fair value
through other comprehensive income, by
default such investments shall be measured
at fair value through profit or loss.
Upon derecognition, the cumulative
gain or loss recognised in Other
Comprehensive Income are not
transferred to profit or loss. However,
cumulative gain or loss recognised full
derecognition will be transferred from
Other Comprehensive Income reserve
to retained earnings within the equity.
Dividends on such investments are
recognised in “Net other operating
income” (Note 13) in the profit or loss.
4.4.10 Reclassification of financial
assets
The Group reclassifies its financial
assets when, and only when, the Group
changes its business model for managing
financial assets. If the Group reclassifies
financial assets which were measured at
amortised cost, fair value through other
comprehensive income or fair value
through profit or loss, the Group applies
the reclassification prospectively from the
reclassification date. The Group does not
restate any previously recognised gains,
losses (including impairment losses) or
interest.
Initial Measurement
Measurement after
reclassification
Treatment on reclassification
Fair value through profit
or loss
Amortised cost
Fair value at the reclassification date becomes its new gross carrying amount. The
effective interest rate is calculated on the basis of that amount. For the purpose of
applying the impairment requirements, the reclassification date is treated as the date
of initial application.
Fair value through profit
or loss
Fair value through other
comprehensive income
The fair value of the financial asset at the reclassification date becomes its new
carrying amount and the effective interest rate is determined on the basis of the fair
value of the asset at the reclassification date.
Fair value through other
comprehensive
Amortised cost
The cumulative gain or loss previously recognised in Other Comprehensive Income is
removed from equity and adjusted against the fair value of the financial asset at the
reclassification date. The effective interest rate and the measurement of expected
credit losses are not adjusted as a result of the reclassification.
Fair value through other
comprehensive income
Fair value through profit
or loss
The fair value of the financial asset at the reclassification date becomes its new
carrying amount. The cumulative gain or loss previously recognised in Other
Comprehensive Income is reclassified from equity to profit or loss as a reclassification
adjustment at the reclassification date.
Amortised cost
Fair value through profit
or loss
Any gain or loss arising from a difference between the previous amortised cost of the
financial asset and fair value at the reclassification date is recognised in profit or loss.
Amortised cost
Fair value through other
comprehensive income
Any gain or loss arising from a difference between the previous amortised cost
of the financial asset and fair value at the reclassification date is recognised in
Other Comprehensive Income. The effective interest rate and the measurement of
expected credit losses are not adjusted as a result of the reclassification.
The table below summaries the treatment of gains and losses on reclassification:

4.4.10.1 Upgrading of financial
instruments
According to the CBSL Direction No.
14 of 2021, the Bank can upgrade
Financial Instruments from a higher stage
in accordance with a policy approved
by the Board of Directors. Therefore,
the Bank will upgrade the Financial
Instruments to a higher stage with the
consent of the Chief Risk Officer with the
proper rational for such upgrade.
4.4.11 Impairment of financial assets
The Group applies a three-stage
approach in measuring expected credit
loss (ECL) for the following categories of
financial assets that are not measured at
fair value through profit or loss:
• Debt instruments measured at
amortised cost and fair value through
other comprehensive income;
• Loan commitments and
Financial guarantee contracts.
No ECL is recognised on equity
investments.
The Group performs an assessment at
the end of each reporting period, of
whether a financial instrument’s credit
risk has increased significantly since initial
recognition, by considering the change
in the risk of default occurring over the
remaining life of the financial instrument.
Based on this process financial assets
migrate through the following three
stages based on the change in credit risk
since initial recognition.
4.4.11.1 Stage 1: 12 months ECL
For exposures where there has not
been a significant increase in credit risk
since initial recognition and that are not
credit impaired upon origination, the
portion of the lifetime ECL associated
with the probability of default events
occurring within the next 12 months is
recognised. The Bank determines 12
months ECL from customers whom are
not significantly credit deteriorated.
4.4.11.2 Stage 2: Lifetime ECL
For exposures where there has been a
significant increase in credit risk since
initial recognition but are not credit
impaired, a lifetime ECL (i.e. reflecting
the remaining lifetime of the financial
asset) is recognised.
4.4.11.3 Stage 3: Lifetime ECL
Exposures are assessed as credit
impaired when one or more events
that have a detrimental impact on the
estimated future cash flows of that asset
have occurred. For exposures that have
become credit impaired, a lifetime ECL
is recognised and interest revenue is
calculated by applying the effective
interest rate to the amortised cost (net of
provision) rather than the gross carrying
amount.
4.4.11.4 Calculation of ECL
The Group calculates ECL based on a
three probability weighted scenarios to
measure the expected cash shortfalls,
discounted at an approximation to
the effective interest rate (EIR). A cash
shortfall is the difference between the
cash flows that are due to an entity
in accordance with the contract and
the cash flows that the entity expects
to receive. The mechanics of the ECL
calculations of the Group are outlined
below and the key elements are, as
follows:
Probability of default (PD)
PD is an estimate of the likelihood of
default over a given time horizon. A
default may only happen at a certain time
over the assessed period, if the facility
has not been previously recognised and
is still in the portfolio. The concept of
PDs is further explained in Note 28.
Exposure at default (EAD)
EAD is an estimate of the exposure at a
future default date, taking into account
expected changes in the exposure after
the reporting date, including repayments
of principal and interest, whether
scheduled by contract or otherwise,
expected drawdowns on committed
facilities, and accrued interest from
missed payments. The EAD is further
explained in Note 28.
Loss given default (LGD)
LGD is an estimate of the loss arising
in the case where a default occurs at a
given time. It is based on the difference
between the contractual cash flows due
and those that the lender would expect
to receive, including from the realisation
of any collateral. It is usually expressed
as a percentage of the EAD. The LGD is
further explained in Note 28.
4.4.11.5 Determining the stage for
impairment
At each reporting date, the Group
assesses whether there has been a
significant increase in credit risk for
exposures since initial recognition by
comparing the risk of default occurring
over the expected life between the
reporting date and the date of initial
recognition. The Group considers
reasonable and supportable information
that is relevant and available without
undue cost or effort for this purpose.
This includes quantitative and qualitative
information and also, forward-looking
analysis.
An exposure will migrate through the
ECL stages as asset quality deteriorates.
If, in a subsequent period, asset
quality improves and also reverses any
previously assessed significant increase
in credit risk since origination, then the
provision for doubtful debts reverts
from lifetime ECL to 12 months ECL.
Exposures that have not deteriorated
significantly since origination, or where
the deterioration remains within the
Group’s investment grade criteria, or
which are less than 30 days past due, are
considered to have a low credit risk. The
impairment provision for these financial
assets is based on a 12 months ECL.
The Group assesses whether the credit
risk on an exposure has increased
significantly on an individual or collective
basis. For the purposes of a collective
evaluation of impairment, financial
instruments are grouped on the basis of
shared credit risk characteristics, taking
into account of instrument type, credit
risk ratings, collateral type, date of initial
recognition, remaining term to maturity,
industry, geographical location of the
borrower and other relevant factors.
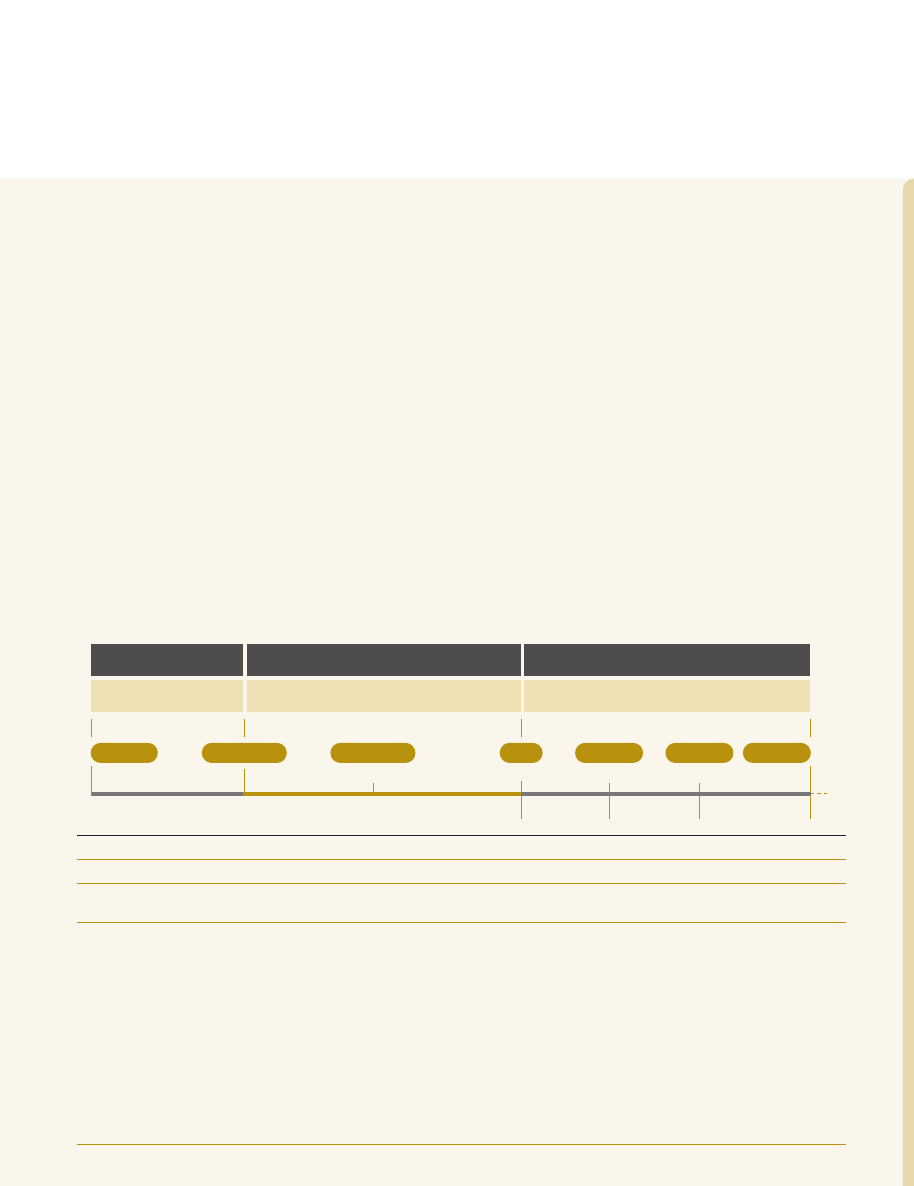
4.4.11.6 Impairment calculation for
loans and advances
The Bank uses rebuttable presumption
in calculating the impairment for loans
and advances which is permitted under
SLFRS 9 – “Financial Instruments”. The
loan portfolio is classified into three
stages based on the past due days as
follows and the level of applicability
STAGE
Performing
Under performing
Non-performing
STAGE
Origination
30 Days DPD
60 Days DPD
180 Days
270 Days
360 Days
NPCF
(more than 90 days)
Special mention
Substandard
Doubtful
Loss
STAGE
1
3
2
of 12 months ECL and lifetime ECL
depends on the stages. The value and
type of security obtained against the
credit facilities are not considered when
determining the classification status
of a credit facility. In cases where a
borrower has several current accounts
with overdraft limits with the Bank, the
aggregate sanctioned limit and the daily
outstanding aggregate balance on all
such accounts shall be considered for the
purposes of classification of overdrafts.
4.4.11.6.1 Performing credit facilities
(a) All the credit facilities classified as
Stage 1 under SLFRS 9 – “Financial
Instruments” and
(b) All credit facilities identified as
significant increase in credit risk
facilities and classified as Stage
2 under SLFRS 9 – “Financial
Instruments” (Under-performing
credit facilities)
4.4.11.6.2 Non-performing credit
facilities (NPCF)
Non-performing credit facilities (NPCF)
shall mean all credit facilities where;
(a) Contractual payments of a customer
are past due for more than 90 days
(the number of days past due shall
be calculated starting from the
contractual due date of the payment).
(b) Sanctioned limit has remained in
excess for more than 90 days.
(c) Any other credit facilities classified as
Stage 3 as per SLFRS 9 – “Financial
Instruments” (facilities classified as
NPCF based on potential risk and
impaired assets at origination).
Performing
Non-performing credit facilities (NPCF)
Stage 01
Stage 02
Stage 03
• 30 days or less than 30 days
past due
• 31 to 89 days past due
• 90 days or more than 90 days past due
• All credit facilities, which are
not categorised under Stages
2 or 3
• All restructured loans, which are
restructured up to two times, other than
credit facilities upgraded and under
the satisfactory performing period of a
minimum 90 days from the due date of
the 1st capital and/ or interest instalment
post-restructure.
• Under-performing credit facilities/
exposures as significant credit
deterioration identified based on the
deterioration factors given under the
Note 28 – “Financial assets at amortised
cost - Loans and advances”.
• All restructured loans, which are restructured more than
twice, other than credit facilities/exposures upgraded
and under the satisfactory performing period of a
minimum 90 days from the due date of the 1st capital
and/or interest installment post-restructure.
• All rescheduled loans, other than credit
facilities/exposures.
• All credit facilities/customers classified as
non-performing as per CBSL Directions.
• Customers identified with significant credit
deterioration as per the deterioration factors given
under Note 28 – “Financial assets at amortised
cost - Loans and advances”.

For the above classification purpose, facility is considered as restructured facility if original repayment terms have been amended
due to deterioration in credit quality and “Credit Forbearance Policy” of the Bank should be referred in identifying the restructured
facilities. As per the Credit Forbearance Policy of the Bank, following changes/criteria are recognised as changes to the original
repayment terms of a credit facility
• Change of Interest Rate
• Change of Tenor (Maturity)
• Changes to the Grace Period
• Interest Waivers
4.4.11.6.3 Subcategorisation of non-performing credit facilities (NPCF)
NPCF are further categorised into four categories based on the past due days and level of potential risk identified as follows:
Category
Past due days
Potential risk criteria
Special mention
> 90 and < = 180
Exhibits potential weaknesses where, if not corrected in a timely manner,
may adversely affect repayment ability of the customer in future.
Substandard
> 180 and < = 270
Exhibits definable weaknesses, either in respect of the business, cash flow
or financial position of the customer that may jeopardize repayment on
existing terms and uncertainty on the repayment.
Doubtful
> 270 and > = 360 days
Exhibit a high risk or partial default or where full collection is improbable
and there is a high risk of default.
Loss
> 360 days
Deemed to be uncollectable or are almost certain repayment will not be
done and all other NPCF which are not included under above categories.
NOTES TO THE FINANCIAL STATEMENTS
4.4.11.7 Upgrading of credit facilities
Upgrading of credit facilities among the
stages will be done based on the level
of improvement in credit deterioration at
the later assessment dates comparing to
the initial point.
The Bank will upgrade the credit facilities
in accordance with the guidelines
provided under the Credit Risk
Management Policy pertaining to the
upgrading of credit facilities.
4.5 Impairment of non-financial
assets
The Group assesses at each reporting
date whether there is an indication
that an asset may be impaired. If
any indication exists, or when annual
impairment testing for an asset is
required, the Bank estimates the
asset’s recoverable amount. An asset’s
recoverable amount is the higher of an
asset’s fair value less costs to sell or its
value in use. Where the carrying amount
of an asset exceeds its recoverable
amount, the asset is considered impaired
and is written down to its recoverable
amount. In assessing the value in use,
the estimated future cash flows are
discounted to their present value using a
pre-tax discount rate that reflects current
market assessments of the time value of
money and the risks specific to the asset.
In determining fair value less costs to sell,
an appropriate valuation model is used.
These calculations are corroborated by
valuation multiples, quoted share prices
for publicly-traded subsidiaries or other
valuable fair value indicators.
4.6 Fiduciary services
The Group provides fiduciary services
to third parties that result in holding of
the assets on behalf of its customers.
Assets held in fiduciary capacity are not
recognised in the Financial Statements,
as the Group is not the beneficial owner
or does not control such assets.
4.7 Provisions
A provision is recognised as a result
of a past event, when the Group has a
present (legal or constructive) obligation
that can be estimated reliably and it is
probable that an outflow of economic
benefits will be required to settle the
obligation. The amount recognised is
the best estimate of the consideration
required to settle the present obligation
at the reporting date, taking into
account the risks and uncertainties
surrounding the obligation at that date.
Where a provision is measured using
the cash flows estimated to settle the
present obligation, its carrying amount
is determined based on the present
value of those cash flows. A provision for
onerous contracts is recognised when

the expected benefits to be derived
by the Group from a contract are lower
than the unavoidable cost of meeting
its obligations under the contract. The
provision is measured as the present
value of the lower of the expected cost
of terminating the contract and the
expected net cost of continuing with the
contract.
4.8 Income tax expense and other
taxes
4.8.1 Income tax expense
Income tax expense comprises current
and deferred tax. More details are given
in Note 18.
4.8.2 Value added tax (VAT) on
financial services
The base for value added tax
computation is arrived by aggregating
the accounting profit before income tax
and emoluments of employees which is
adjusted for the depreciation computed
on prescribed rates. During the year,
the Group’s total value addition was
subjected to 18% with effect from 1
January 2022 as per the Value Added Tax
Act, No. 14 of 2002 and amendments
thereto. Also the Group is following value
attributable method to compute VAT on
financial services.
4.8.3 Crop insurance levy (CIL)
As per the provisions of the Finance Act,
No. 12 of 2013, the CIL was introduced
with effect from 1 April 2013 and is
payable 1% of the profit after tax to the
National Insurance Trust Fund Board.
4.8.4 Social security contribution levy
(SSCL)
In terms of the Social Security Contribution
Levy Act, No. 25 of 2022, the Bank is
liable for Social Security Contribution
Levy on financial services with effect from
1 October 2022 on the value addition
attributable to financial services at the rate
of 2.5%. Further, SSCL on non-financial
services are made liable on the turnover at
the rate of 2.5%.
4.8.5 Withholding tax (WHT) on
dividends distributed by the Bank,
Subsidiaries and Associates
Withholding tax on dividends distributed
by the Bank
The Bank distributes dividend to its
sole shareholder, the Government of
Sri Lanka. As per the third schedule of
Inland Revenue Act, No 24 of 2017 and
amendments thereto, amounts derived
by the Government of Sri Lanka is
exempted from income tax. Accordingly,
no withholding tax is deducted on
dividend payments made to the
Government of Sri Lanka.
WHT on dividends distributed by the
subsidiaries and associates
As per the Inland Revenue (Amendment)
Act, No. 45 of 2022 WHT on dividends
has been introduced with effect from
1 January 2023. Accordingly, dividend
income received from subsidiaries and
associate companies is liable for WHT at
the rate of 15% and it is a final tax for the
Bank.
5
Insurance business
5.1 Reinsurance
The Group cedes insurance risk in
the normal course of business for all
of its businesses. Reinsurance assets
represent balances due from reinsurance
companies. Amounts recoverable from
reinsurers are estimated in a manner
consistent with the outstanding claims
provision or settled claims associated
with the reinsurer’s policies and are in
accordance with the related reinsurance
contract. Reinsurance assets are reviewed
for impairment at each reporting date or
more frequently when an indication of
impairment arises during the reporting
year. Impairment occurs when there is
objective evidence as a result of an event
that occurred after initial recognition
of the reinsurance asset that the Group
may not receive all outstanding amounts
due under the terms of the contract
and the event has a reliably measurable
impact on the amounts that the Group
will receive from the reinsurer. The
impairment loss is recorded in the
Statement of Profit or Loss. Premiums
and claims are presented on a gross
basis for reinsurance. Reinsurance assets
or liabilities are derecognised when the
contractual rights are extinguished or
expire or when the contract is transferred
to another party.
5.2 Insurance receivables
Insurance receivables are recognised
when due and measured on initial
recognition at the fair value of the
consideration receivable. The carrying
value of insurance receivables is reviewed
for impairment whenever events or
circumstances indicate that the carrying
amount may not be recoverable, with
the impairment loss recorded in the
Statement of Profit or Loss.
5.3 Deferred expenses
5.3.1 Deferred acquisition costs
(DAC)
The costs of acquiring new businesses
including commission, underwriting,
marketing and policy issue expenses
which vary with and directly related to
production of new businesses and/or
investment contracts with discretionary
participation features (DPF), are deferred
to the extent that these costs are
recoverable out of future premiums. All
other acquisition costs are recognised as
an expense when incurred. Subsequent
to initial recognition, DAC for general

insurance is amortised over the period
on the basis unearned premium is
amortised. The reinsurances’ share of
deferred acquisition cost is amortised
in the same manner as the underlying
assets amortisation is recorded in the
Statement of Profit or Loss. Changes in
the expected useful life or the expected
pattern of consumption of future
economic benefits embodied in the
assets are accounted for by changing
the amortisation period and are treated
as a change in an accounting estimate.
DAC are derecognised when the related
contracts are either expired or cancelled.
5.4 Reinsurance commissions
Commissions receivable on outwards
reinsurance contracts are deferred and
amortised over the period of reinsurance.
5.5 Investment contract liabilities
Investment contracts are classified
between contracts with and without
DPF. The accounting policies for
investment contract liabilities with DPF
are the same as those for life insurance
contract liabilities. Investment contract
liabilities without DPF are recognised
when contracts are entered into and
premiums are charged. These liabilities
are initially recognised at fair value being
the transaction price excluding any
transaction costs directly attributable to
the issue of the contract. Subsequent to
initial recognition, investment contract
liabilities are measured at fair value
through profit or loss. Deposits and
withdrawals are recorded directly as
an adjustment to the liability in the
Statement of Financial Position. Fair
value adjustments are performed at
each reporting date and are recognised
in the Statement of Profit or Loss. Fair
value is determined through the use
of prospective discounted cash flow
techniques. For unitised contracts, fair
value is calculated as the number of units
allocated to the policyholder in each unit
linked fund multiplied by the unit price
of those funds at the reporting date. The
fund assets and fund liabilities used to
determine the unit prices at the reporting
date are valued on a basis consistent with
their measurement basis in the Statement
of Financial Position adjusted to take
account of the effect on the liabilities of
the deferred tax on unrealised gains on
assets in the fund. Non-utilised contracts
are subsequently carried at fair value,
which is determined by using valuation
techniques such as discounted cash flows
and stochastic modelling. Models are
validated, calibrated and periodically
reviewed by an independent qualified
person.
The liability is derecognised when the
contract expires, is discharged or is
cancelled. For a contract that can be
cancelled by the policyholder, the fair
value cannot be less than the surrender
value. When contracts contain both a
financial risk component and a significant
insurance risk component and the cash
flows from the two components are
distinct and can be measured reliably,
the underlying amounts are unbundled.
Any premiums relating to the insurance
risk component are accounted for on the
same bases as insurance.
5.6 Discretionary participation
features (DPF)
A DPF is a contractual right that gives
holders of these contracts the right to
receive as a supplement to guaranteed
benefits, significant additional benefits
which are based on the performance
of the assets held within the DPF
portfolio. Under the terms of the
contract, surpluses in the DPF funds
can be distributed to policyholders
and shareholders on a 90/10 basis.
The Group has the discretion over the
amount and timing of the distribution of
these surpluses to policyholders. All DPF
liabilities including unallocated surpluses,
both guaranteed and discretionary,
at annually are held within insurance
or investment contract liabilities as
appropriate.
5.7 Unearned premium reserve
Unearned premium reserve represents
the portion of the premium written in the
year but relating to the unexpired term
of coverage. Unearned premiums are
calculated on the 1/24th basis.
6
New and amended
standards and
interpretations
6.1 New Accounting Standards
issued during the year/changes
to already existing accounting
standards.
6.1.1 Amendments to LKAS 8 -
“Accounting Policies, Changes in
Accounting Estimates and Errors”
The amendments clarify the following.
• Distinction between changes in
accounting estimates, changes
in accounting policies and the
correction of errors.
• How entities use measurement
techniques and inputs to develop
accounting estimates.
• A change in an input or a change in a
measurement technique are changes
in accounting estimates if they do
not result from the correction of prior
period errors.
The effective date is 1 January 2023.
These amendments have no material
impact on the Financial Statements of the
Bank/Group.

6.1.2 Amendments to LKAS
1 – “Presentation of Financial
Statements”
These amendment:
• replaces the requirement for entities
to disclose their “significant”
accounting policies with a
requirement to disclose “material”
accounting policies.
• provides guidance on how entities
apply the concept of materiality in
making decisions about accounting
policy disclosures.
• specify the requirements for
classifying liabilities as current or non-
current.
The effective date is 1 January 2023
These amendments have no material
impact on the Financial Statements of the
Bank/Group.
6.1.3 Amendments to LKAS 12 –
“Income Taxes”
The amendments introduce an exception
to the initial recognition exemption in
LKAS 12 – “Income Taxes”. The effect
of these amendments essentially mean
that the initial recognition exemption
is not available for transactions which
involve the recognition of both an asset
and liability which in turn leads to equal
and opposite temporary differences.
Therefore, deferred taxes are calculated
and booked for both temporary
differences, at initial recognition and
subsequently.
The effective date is 1 January 2023.
These amendments have no material
impact on the Financial Statements of the
Bank/Group.
6.2 New accounting standards issued
but not effective as at the reporting
date
The following Sri Lanka Accounting
Standards were issued by The Institute
of Chartered Accountants of Sri Lanka
which is effective for the annual period
beginning on or after 1 January 2024.
Accordingly, these accounting standard
has not been applied in the preparation
of the Financial Statements for the year
ended 31 December 2023. We have
identified following Standard where this
applies to the Group and further details
are set out below:
6.2.1 SLFRS 17 – “Insurance
contracts”
SLFRS 17 – “Insurance Contracts”
establishes principles for the recognition,
measurement, presentation and
disclosure of insurance contracts within
the scope of the standard. The objective
of SLFRS 17 –“Insurance Contracts” is to
ensure that an entity provides relevant
information that faithfully represents
those contracts. This information gives a
basis for users of Financial Statements to
assess the effect that insurance contracts
have on the entity’s financial position,
financial performance and cash flows.
SLFRS 17 – “Insurance Contracts” is
effective for annual periods beginning on
or after 1 January 2026.
The Group is assessing the potential
impact on its Financial Statements
resulting from the application of SLFRS
17 – “Insurance Contracts”.
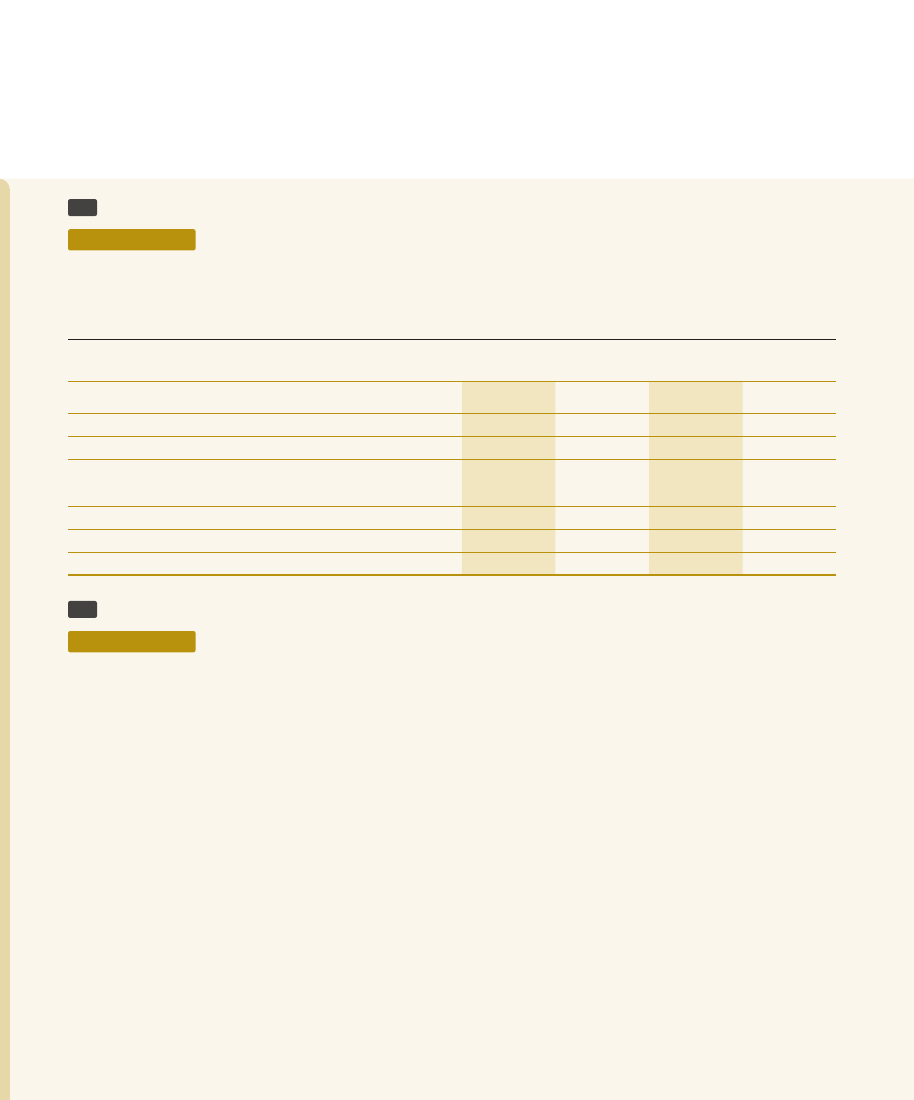
NOTES TO THE FINANCIAL STATEMENTS
NOTES TO THE FINANCIAL STATEMENTS
7
Total income
Accounting policy
Revenue is recognised to the extent that it is probable that the economic benefits will flow to the Bank/ Group and the revenue can
be reliably measured.
Bank
Group
For the year ended 31 December
Note
2023
2022
2023
2022
LKR ‘000
LKR ‘000
LKR ‘000
LKR ‘000
Interest income
8.1
524,797,842
456,267,458
532,477,761
463,203,346
Fee and commission income
9.1
25,875,048
22,837,771
26,235,325
23,165,682
Net gains/ (losses) from trading
10
(5,347,822)
17,602,384
(5,163,417)
17,678,455
Net fair value gains/ (losses) from financial instruments
at fair value through profit or loss
11
858,722
(804,438)
1,448,963
(956,745)
Net gains/ (losses) from derecognition of financial assets
12
1,361,863
861,349
1,469,888
877,853
Net other operating income
13
(5,358,356)
16,384,811
(4,601,757)
16,922,573
Total income
542,187,297
513,149,335
551,866,763
520,891,164
8
Net interest income
Accounting policy
Interest income and expense are recognised in the Statement of Profit or Loss using the Effective Interest Rate (EIR).
Interest income and expense presented in the Statement of Profit or Loss include interest on;
Financial assets and financial liabilities measured at Amortised Cost (AC)
Financial assets recognised through Profit or Loss - Measured at Fair Value (FVTPL)
Financial assets measured at Fair Value Through Other Comprehensive Income (FVTOCI)
Effective Interest Rate (EIR)
The ‘EIR’ is the rate that exactly discounts the estimated future cash payments and receipts throughout the expected life of the
financial asset or financial liability (or, where appropriate, a shorter period) to the carrying amount of the financial asset or financial
liability. When calculating the EIR, the Group estimates future cash flows, considering all contractual terms of the financial instruments.
The calculation of the EIR includes any discount or premium on acquisition of financial instrument, transaction costs and fees paid or
received that are an integral part of the EIR. Transaction costs include incremental costs that are directly attributable to the acquisition
or issue of a financial asset or financial liability.
For impaired financial assets, adjusted EIR is calculated using estimated future cash flows and if the financial assets cures and no
longer credit impaired, the bank reverts to calculating interest income on gross basis.
The expected cashflows on financial asset are revised for reasons other than credit risk, the adjustment is made to carrying value of
the assets in statement of financial position with an adjustment to interest income or similar income in the statement of profit or losse.

8.1 Interest income
Bank
Group
For the year ended 31 December
2023
2022
2023
2022
LKR ‘000
LKR ‘000
LKR ‘000
LKR ‘000
Cash and cash equivalents
2,162,274
595,465
2,162,274
881,761
Placements with banks
2,635,457
396,817
3,091,095
405,672
Securities purchased under resale agreements
1,776,019
96,718
1,810,576
75,167
Financial assets recognised through profit or loss
measured at fair value
5,328,979
444,197
5,328,979
447,726
Financial assets at amortised cost
loans and advances
335,051,290
310,238,562
340,286,641
316,070,181
debt and other instruments
175,305,169
143,777,962
177,255,006
144,543,793
Financial assets measured at fair value through OCI
2,538,654
717,737
2,543,190
779,046
Total interest income
524,797,842
456,267,458
532,477,761
463,203,346
Interest income on loans and advances includes interest on credit impaired loans and advances amounting to LKR 5,827.9 million for
the year 2023 (2022 - LKR 1,745.7 million).
8.2 Interest expenses
Bank
Group
For the year ended 31 December
2023
2022
2023
2022
LKR ‘000
LKR ‘000
LKR ‘000
LKR ‘000
Due to banks
94,251
477,472
114,668
511,004
Securities sold under repurchase agreements
33,146,868
36,443,268
33,146,868
36,438,543
Financial liabilities at amortised cost
due to depositors
377,581,695
231,793,666
381,012,800
234,767,352
other borrowings
10,734,756
52,848,179
10,716,574
53,413,547
Subordinated liabilities
12,052,686
8,358,495
11,976,739
8,304,008
Total interest expenses
433,610,256
329,921,080
436,967,649
333,434,454
Net interest income
91,187,586
126,346,378
95,510,112
129,768,892
8.3 Net interest income from Sri Lanka Government Securities
Bank
Group
For the year ended 31 December
2023
2022
2023
2022
LKR ‘000
LKR ‘000
LKR ‘000
LKR ‘000
Interest income
171,796,811
119,745,901
173,685,878
119,805,011
Less : Interest expenses
33,146,868
36,443,268
33,146,868
36,438,543
Net interest income from Sri Lanka Government Securities
138,649,943
83,302,633
140,539,010
83,366,468
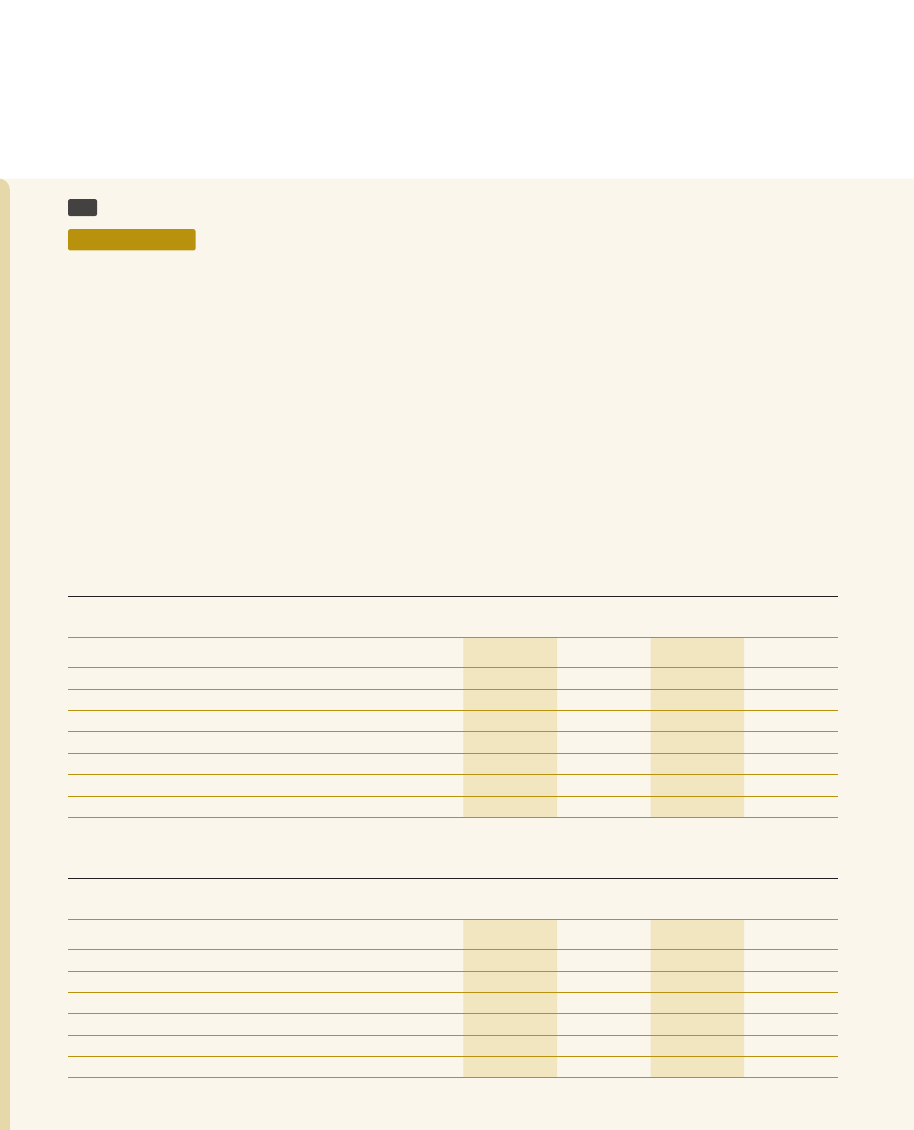
9
Net fee and commission income
Accounting policy
Fee and commission income comprises with the fee and commission earned by the Group, providing diverse range of services. Those
can be divided into following two main categories.
(i) Fee and commission income earned from services that are provided over a certain period of time;
Fees earned from the provision of services over a period of time are accrued over that period. These fees include commission income
and private wealth and asset management fees, custody and other management and advisory fees.
(ii) Fee and commission income from providing transaction services and earned on the execution of a specific act;
Fees and commission arising from negotiating or participating in the negotiation of a transaction for a third party, such as the
arrangement/ participation or negotiation of the acquisition of shares or other securities, or the purchase or sale of businesses, are
recognised on completion of the underlying transaction. Fees or components of fees that are linked to a certain performance are
recognised after fulfilling the corresponding criteria.
Fees and commission expenses relating to transactions are expensed as the services are received and are recognised on an accrual
basis.
9.1 Fee and commission income
Bank
Group
For the year ended 31 December
2023
2022
2023
2022
LKR ‘000
LKR ‘000
LKR ‘000
LKR ‘000
Trade services
3,261,176
3,931,144
3,261,176
4,060,300
Debit and credit cards
11,633,316
8,876,177
11,634,947
8,876,177
Travel and remittances services
3,335,485
3,744,864
3,335,485
3,753,231
Custodial services
64,847
60,667
64,847
60,667
Retail banking services
4,699,583
3,890,089
4,883,879
4,057,370
Guarantees and related services
1,921,328
1,582,641
1,921,328
1,582,641
Other financial services
959,313
752,189
1,133,663
775,296
Total fee and commission income
25,875,048
22,837,771
26,235,325
23,165,682
9.2 Fee and commission expense
Bank
Group
For the year ended 31 December
2023
2022
2023
2022
LKR ‘000
LKR ‘000
LKR ‘000
LKR ‘000
Debit and credit cards
7,303,632
5,830,252
7,304,476
5,830,252
Travel and remittances services
258,035
266,482
258,035
266,482
Retail banking services
599,440
360,240
599,440
379,445
Guarantees and related services
19,864
10,728
19,864
10,728
Other financial services
39,658
18,427
55,571
18,427
Total fee and commission expenses
8,220,629
6,486,129
8,237,386
6,505,334
Net fee and commission income
17,654,419
16,351,642
17,997,939
16,660,348
10
Net gains/ (losses) from trading
Accounting policy
Net gains/ (losses) from trading comprises foreign exchange gains or losses arising from trading activities, gains/ (losses) arising from
changes in fair value of derivative financial instruments, dividend income from trading equities.
Dividend income is recognised when the Group’s right to receive the dividend is established.
Bank
Group
For the year ended 31 December
2023
2022
2023
2022
LKR ‘000
LKR ‘000
LKR ‘000
LKR ‘000
Foreign exchange
From banks
-
6,494
172,155
76,071
From customers and others
(5,431,748)
17,522,608
(5,431,748)
17,529,102
Equities
Dividend income
83,926
73,282
96,176
73,282
Net gains/ (losses) from trading
(5,347,822)
17,602,384
(5,163,417)
17,678,455
11
Net fair value gains/(losses) from financial instruments at fair value through profit or loss
Accounting policy
Net gains/ (losses) on financial instruments at fair value through profit or loss includes unrealised gains or losses from investment in
equities and debt instruments classified at fair value through profit or loss due to changes in fair value of such instruments.
Bank
Group
For the year ended 31 December
2023
2022
2023
2022
LKR ‘000
LKR ‘000
LKR ‘000
LKR ‘000
Gains/ (losses) on marked to market valuation of
Fixed income securities
79,102
29,671
638,326
29,671
Equities
437,879
(691,331)
440,102
(843,638)
Unit trust
341,741
(142,778)
370,535
(142,778)
Net gains/(losses) on financial assets at fair value
through profit or loss
858,722
(804,438)
1,448,963
(956,745)
12
Net gains/(losses) from derecognition of financial assets
Accounting policy
Net gains/ (losses) from derecognition of financial assets include profit or loss on sale of debt instruments classified as fair value
through profit or loss, amortised cost and fair value through other comprehensive income and profit or loss on sale of equity
instrument classified as fair value through profit or loss.
Bank
Group
For the year ended 31 December
2023
2022
2023
2022
LKR ‘000
LKR ‘000
LKR ‘000
LKR ‘000
Recognised at:
Fair value through profit or loss
702,105
751,322
702,105
766,423
Amortised cost
-
-
-
-
Fair value through other comprehensive income
659,758
110,027
767,783
111,430
Net gains/(losses) from derecognition of financial assets
1,361,863
861,349
1,469,888
877,853
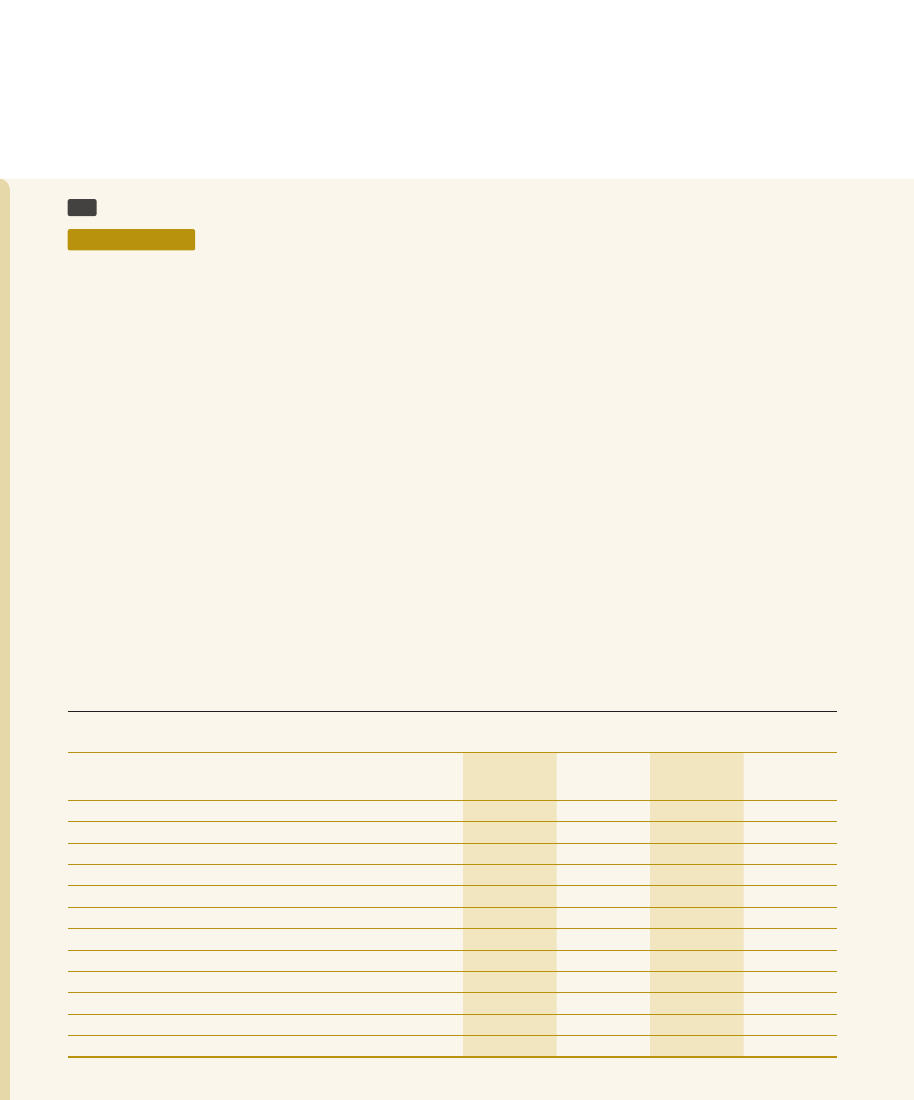
13
Net other operating income
Accounting policy
Dividend income
Dividend income is recognised when the Bank’s right to receive the dividend is established.
Gains / (losses) from disposal of non-financial assets
Net gains / (losses) arising from the disposal of property, plant and equipment and other non current assets including investments in
subsidiaries and associates are accounted for in the Statement of Profit or Loss after deducting the carrying amount of such assets
and the related selling expenses from the proceeds on disposal.
Foreign exchange income
Foreign currency positions are revalued at each reporting date. Gains / (losses) arising from changes in fair value are included in the
Statement of Profit or Loss in the period in which they arise.
Rental income
Rental income is recognised on an accrual basis. This includes rent recovered from the Bank’s premises and safety lockers etc..
Gross insurance premium
Gross recurring premiums on life and investment contracts with Discretionary Participation Features (DPF) are recognised as revenue
when receivable from the policyholder. For single premium business, revenue is recognised on the date on which the policy is
effective.
Gross general insurance written premiums comprise the total premiums receivable for the whole period of cover provided by
contracts entered into during the accounting period and are recognised on the date on which the policy commences.
Bank
Group
For the year ended 31 December
Note
2023
2022
2023
2022
LKR ‘000
LKR ‘000
LKR ‘000
LKR ‘000
Dividend income from financial assets measured at fair
value through OCI
238,083
377,695
292,473
441,973
Dividend income from subsidiaries and associates
372,900
107,430
-
-
Dividend income from units in unit trust
-
-
450
171
Gains / (losses) on revaluation of foreign exchange
(7,231,150)
15,450,104
(7,231,150)
15,450,104
Gains / (losses) on sale of property, plant and equipment
(6,612)
(7,950)
8,607
(7,410)
Gains / (losses) on sale of foreclosed properties
47,145
23,507
47,145
23,507
Rental income
300,057
235,980
272,756
232,728
Service income
-
-
850,557
280,468
Profit from sale of gold bullion
6,789
6,069
6,974
-
Miscellaneous income
950,333
131,581
708,772
84,685
Gross insurance premium
-
-
477,560
355,952
Net income from islamic banking
13.1
(35,901)
60,395
(35,901)
60,395
Net other operating income
(5,358,356)
16,384,811
(4,601,757)
16,922,573

13.1 Net income from islamic banking
Bank/Group
For the year ended 31 December
2023
2022
LKR ‘000
LKR ‘000
Income from islamic banking operations
155,252
266,617
Less : Profit paid to investors
191,153
206,222
Net income from islamic banking
(35,901)
60,395
14
Impairment charge / (reversal) for loans and other losses
Accounting policy
The Bank and Group recognise the changes in the impairment provisions for financial instruments, which are assessed as per Sri
Lanka Accounting Standard - SLFRS 9 - “Financial Instruments”. Details are given under "Financial assets at amortised cost - loans
and advances" (Note 28). Further, the Bank/ Group recognises an impairment loss when the carrying amount of a non financial asset
exceeds the estimated recoverable amount of that asset as per Sri Lanka Accounting Standard - LKAS 36 - “Impairment of Assets”.
The table below shows the provision made in the Statement of profit or loss during the year on identified Expected Credit Losses
(ECL) on financial instruments for the year.
Bank
Group
Note
2023
2023
For the year ended 31 December
Stage 1
Stage 2
Stage 3
Total
Stage 1
Stage 2
Stage 3
Total
LKR ‘000
LKR ‘000
LKR ‘000
LKR ‘000
LKR ‘000
LKR ‘000
LKR ‘000
LKR ‘000
Cash and cash equivalents
22.2
38,436
-
-
38,436
38,436
-
-
38,436
Placements with banks
24.2
(275,170)
-
-
(275,170)
(275,170)
-
-
(275,170)
Financial assets measured at
amortised cost - loans and advances 28.2
(7,670,654)
6,263,585
(1,256,775)
(2,663,844)
(7,817,368)
6,257,962
(1,261,537)
(2,820,943)
Financial assets measured at
amortised cost - debt instruments
29.3
(320,867)
(1,684,832)
-
(2,005,699)
(320,867)
(1,684,832)
-
(2,005,699)
Financial assets measured at fair
value through OCI
30.4
-
-
-
-
14,710
-
-
14,710
impairment charge/ (reversal) for
loans and other losses
(8,228,255)
4,578,753
(1,256,775)
(4,906,277)
(8,360,259)
4,573,130
(1,261,537)
(5,048,666)
Bank
Group
Note
2022
2022
For the year ended 31 December
Stage 1
Stage 2
Stage 3
Total
Stage 1
Stage 2
Stage 3
Total
LKR ‘000
LKR ‘000
LKR ‘000
LKR ‘000
LKR ‘000
LKR ‘000
LKR ‘000
LKR ‘000
Cash and cash equivalents
22.2
11,952
-
-
11,952
10,356
-
-
10,356
Placements with banks
24.2
319,416
-
-
319,416
317,348
-
-
317,348
Financial assets measured at
amortised cost - loans and advances 28.2
15,135,491
10,344,926
45,280,265
70,760,682
15,204,835
10,365,092
45,174,250
70,744,177
Financial assets measured at
amortised cost - debt instruments
29.3
(13,446,853)
29,510,499
-
16,063,646
(13,287,475)
29,510,499
-
16,223,024
Impairment charge/ (reversal) for
loans and other losses
2,020,006
39,855,425
45,280,265
87,155,696
2,245,064
39,875,591
45,174,250
87,294,905
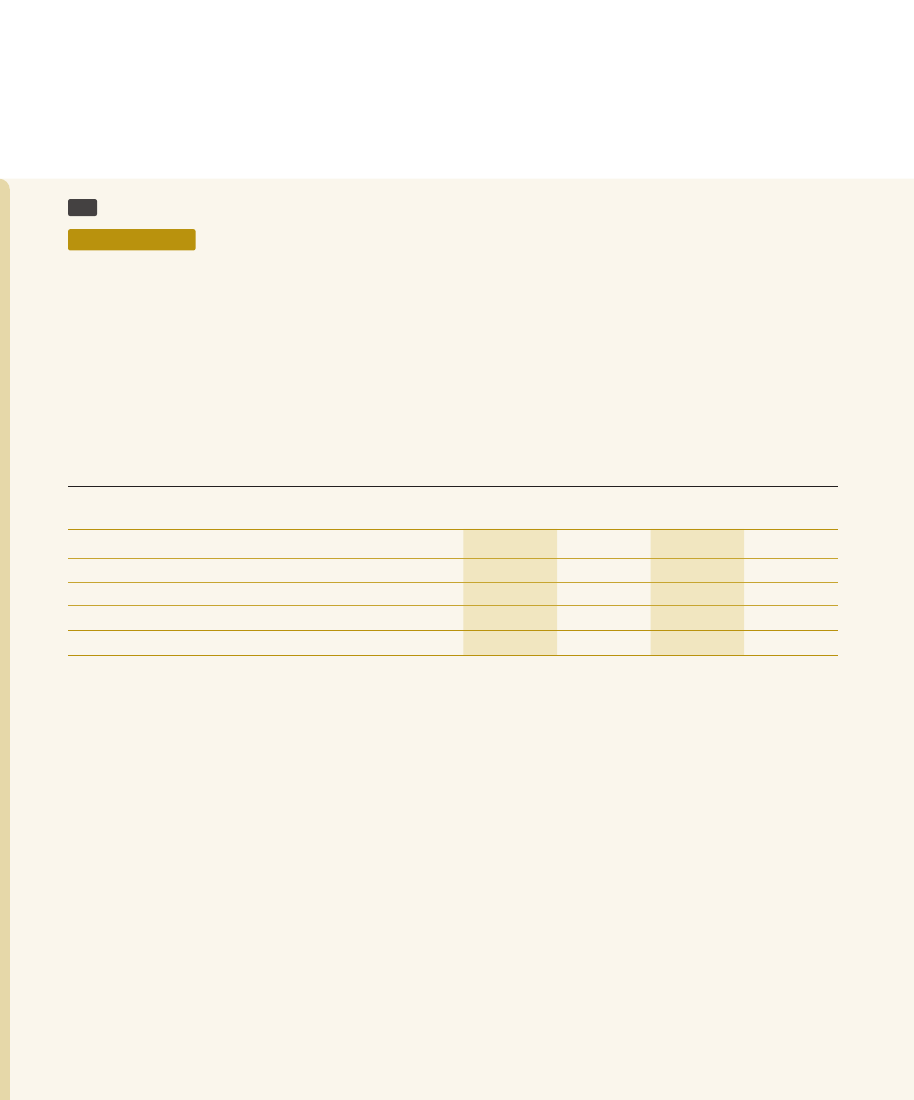
15
Personnel expenses
Accounting policy
Personnel expenses include staff emoluments, contribution to defined contribution and benefit plans and other related expenses.
Short-term employee benefit obligations are measured on an undiscounted basis and are expensed as the related service is provided.
A liability is recognised for the amount expected to be paid under short term cash bonus, if the Group has a present legal or
constructive obligation to pay this amount as a result of past service provided by the employee and the obligation can be estimated
reliably.
Employees are eligible for contribution to defined contribution and benefit plans in accordance with the respective internal and
external statutes and regulations.
Defined benefit plans are recognised in the Statement of Profit or Loss based on actuarial valuations carried out in accordance with
Sri Lanka Accounting Standard - LKAS 19 - “Employee Benefits”.
Bank
Group
For the year ended 31 December
Note
2023
2022
2023
2022
LKR ‘000
LKR ‘000
LKR ‘000
LKR ‘000
Staff emoluments
23,866,223
23,859,475
25,711,503
25,693,378
Contributions to defined contribution plans
15.1
2,201,668
2,048,765
2,383,340
2,229,393
Contributions to defined benefit plans
15.2
1,868,440
1,455,762
1,982,003
1,539,682
Other personnel expenses
1,881,868
1,627,427
2,234,835
1,890,525
Total personnel expenses
29,818,199
28,991,429
32,311,681
31,352,978
15.1 Contributions to defined contribution plans
A Defined Contribution Plan (DCP) is a post-employment benefit plan under which an entity pays fixed contributions into a separate
entity and will have no legal or constructive obligation to pay further amounts. Obligations for contributions to defined contribution
plans are recognised as an expense in the Statement of Profit or Loss when they are due in respect of service rendered before the
end of the Reporting period. Prepaid contributions are recognised as an asset to the extent that a cash refund or a reduction in future
payments
is
available.
Bank of Ceylon Provident Fund
All employees of the Bank are members of the ‘Bank of Ceylon Provident Fund’ to which the Bank contributes 12% of employees’
monthly gross salary while employees contribute 8%. This fund is an approved fund, which is independently administered.
Employees’ Provident Fund
The subsidiaries and their employees (other than Bank of Ceylon and its employees) contribute 12% (15% by Property Development
Limited and Hotel Colombo Limited) and 8% (10% by Property Development Limited’s and Hotel Colombo Limited’s employees)
respectively on monthly gross salary of each employee to Employees’ Provident Fund, in terms of the Employees’ Provident Fund Act
No. 15 of 1958 and subsequent amendments thereto. The respective fund is managed by the Central Bank of Sri Lanka.
Employees’ Trust Fund
All employees of the Bank and its subsidiaries are members of the Employees’ Trust Fund to which the Bank and the Group
contributes 3% of the employee’s monthly gross salary, in terms of Employees’ Trust Fund Act No.46 of 1980.
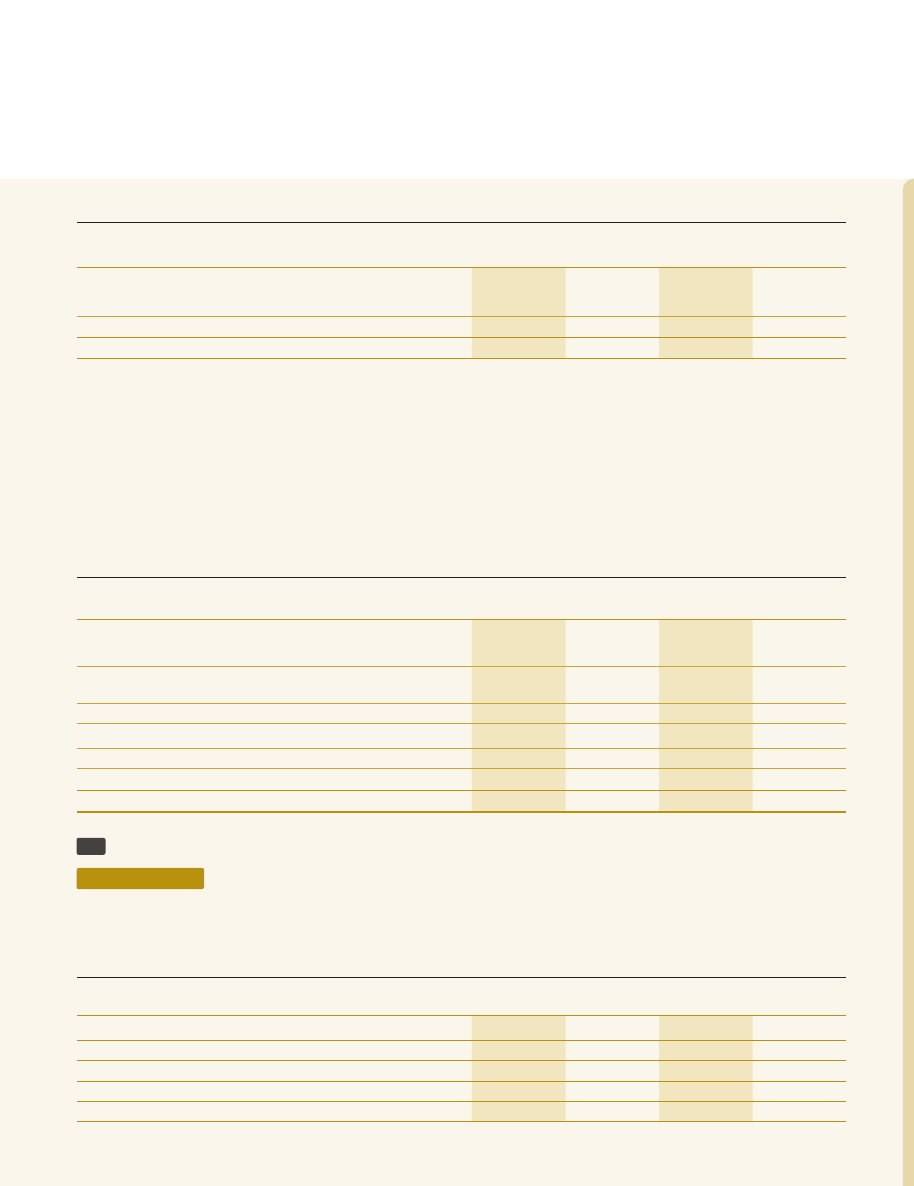
Bank
Group
For the year ended 31 December
2023
2022
2023
2022
LKR ‘000
LKR ‘000
LKR ‘000
LKR ‘000
Employers’ contribution to:
Bank of Ceylon/Employees' Provident Fund
1,766,295
1,643,180
1,912,518
1,792,776
Employees' Trust Fund
435,373
405,585
470,822
436,617
Total contributions to defined contribution plans
2,201,668
2,048,765
2,383,340
2,229,393
15.2 Contributions to defined benefit plans
A Defined Benefit Plan (DBP) is a post-employment benefit plan other than a DCP. The Group’s net obligation in respect of DBP is
calculated separately for each plan by estimating the amount of future benefit that employees have earned in return for their service
in the current and prior periods and discounting that benefit to determine its present value and then deducting the fair value of any
plan assets. The discount rate is the yield at the reporting date on long-term treasury bond rate for discount rates actually used that
have maturity dates approximating the terms of the Group’s obligations. The calculation is performed by a qualified Actuary using the
“Projected Unit Credit method”.
The Group recognises all actuarial gains and losses arising from DBP in the OCI and the expenses related to DBP under personnel expenses
in the Statement of Profit or Loss. Details of defined benefit plans are given in “Employee retirement benefit plans” (Note 48).
Bank
Group
For the year ended 31 December
Note
2023
2022
2023
2022
LKR ‘000
LKR ‘000
LKR ‘000
LKR ‘000
Net expenses recognised in the profit or loss
Bank of Ceylon Pension Trust Fund
48.1.1
4,896,595
2,514,177
4,896,595
2,514,177
Bank of Ceylon Widows'/ Widowers' and
Orphans’ Pension Fund
48.2.1
(1,807,265)
(1,319,754)
(1,807,265)
(1,319,754)
Terminal gratuity
48.3
173,686
105,253
273,972
180,221
Bank of Ceylon Pension Fund - 2014
48.4.1
(1,566,380)
83,081
(1,566,380)
83,081
Provision for encashment of medical leave
48.5
171,804
73,005
171,804
73,005
Pension fund - Bank of Ceylon (UK) Limited
-
-
13,277
8,952
Total contributions to defined benefit plans
1,868,440
1,455,762
1,982,003
1,539,682
16
Depreciation and amortisation expenses
Accounting policy
The Group provides depreciation from the date the assets are available for use upto the point the assets can be used for economic
activities. Depreciation of the assets ceases at the point of the date that the asset is classified held for sale or the date that the asset is
derecognised. Depreciation does not ceases when the asset become idle or is retired from active use unless asset is fully depreciated.
Bank
Group
For the year ended 31 December
Note
2023
2022
2023
2022
LKR ‘000
LKR ‘000
LKR ‘000
LKR ‘000
Depreciation of investment properties
33
-
-
9,190
2,906
Depreciation of property, plant and equipment
34
1,846,426
1,894,960
2,692,672
2,717,917
Amortisation of right of use assets/ leasehold properties
35
1,522,030
1,759,054
1,002,250
990,918
Amortisation of intangible assets
36
484,475
632,885
525,130
795,627
Total depreciation and amortisation expenses
3,852,931
4,286,899
4,229,242
4,507,368

17
Other expenses
Accounting policy
Other expenses have been recognised in the Statement of Profit or Loss as they are incurred in the period to which they relate. All
expenditure incurred in the operation of the business and in maintaining the capital assets in a state of efficiency has been charged
to revenue in arriving at the Group’s profit for the year. Provisions in respect of other expenses are recognised when the Group has a
present obligation (legal or constructive) as a result of a past event, it is probable that an outflow of resources emboding economic
benefits will be required to settle the obligation and a reliable estimate can be made of the amount of the obligation.
Deposit insurance premium
As per the Sri Lanka Deposit Insurance and Liqudity Support Scheme introduced under the Banking Act Direction No.06 of 2010,
the Group is required to make quarterly payments of 0.1% or 0.125% on the eligible deposit liabilities, from 1 October 2010. The
premium rate depends on the Capital Adequacy Ratio (CAR) of the immediate preceeding Audited Financial Statements.
Reinsurance premium, claims and other benefits
Gross benefits and claims for life insurance contracts and for investment contracts with Discretionary Participation Features (DPF)
include the cost of all claims arising during the year including internal and external claims handling costs that are directly related
to the processing and settlement of claims and policyholder bonuses declared on DPF contracts, as well as changes in the gross
valuation of insurance and investment contract liabilities with DPF. Death claims and surrenders are recorded on the basis of
notifications received. Maturities and annuity payments are recorded when due. Interim payments and surrenders are accounted at
the time of settlement.
General insurance include all claims occurring during the year, whether reported or not, related internal and external claims handling
costs that are directly related to the processing and settlement of claims, a reduction for the value of salvage and other recoveries,
and any adjustments to claims outstanding from previous years.
Claims expenses and liabilities for outstanding claims are recognised in respect of direct and inward reinsurance business. The liability
covers claims reported but not yet paid, Incurred But Not Reported (IBNR) claims and the anticipated direct and indirect costs of
settling those claims. Claims outstanding are assessed by review of individual claim files and estimating changes in the ultimate cost
of settling claims. The provision in respect of IBNR is actuarially valued on an annual basis to ensure a more realistic estimation of the
future liability based on past experience and trends.
While the Directors consider that the provision for claims is fairly stated on the basis of information currently available, the ultimate
liability will vary as a result of subsequent information and events. This may result in adjustment to the amounts provided. Such
amounts are reflected in the Financial Statements for that period. The methods used and the estimates made are reviewed regularly.
Reinsurance claims are recognised when the related gross insurance claim is recognised according to the terms of the relevant
contract.
Bank
Group
For the year ended 31 December
2023
2022
2023
2022
LKR ‘000
LKR ‘000
LKR ‘000
LKR ‘000
Directors' emoluments
2,975
4,200
117,961
13,748
Auditors' remuneration
Audit fees
46,612
35,504
99,805
78,277
Non-audit fees
-
-
1,372
766
Deposit insurance premium
3,271,248
3,111,665
3,306,617
3,146,594
Professional and legal expenses
236,828
158,948
303,084
242,892
Net revaluation (gain)/ loss on lands and buildings
341,757
(3,200)
341,757
(3,200)
Fixed assets maintenance expenses
5,872,616
3,737,614
5,956,869
3,408,364
Reinsurance premium, claims and other benefits
-
-
459,618
291,024
Office administration and establishment expenses
8,813,531
6,973,430
9,887,046
8,245,501
Total other expenses
18,585,567
14,018,161
20,474,129
15,423,966

18
Taxes
18.1 Taxes on financial services
Accounting policy
Taxes on financial services include Value Added Tax (VAT) and Social Security Contribution Levy (SSCL) calculated based on the value
addition made on financial services.
Bank
Group
For the year ended 31 December
2023
2022
2023
2022
LKR ‘000
LKR ‘000
LKR ‘000
LKR ‘000
Value added tax
11,122,618
11,031,979
11,378,354
11,155,847
Social security contribution levy
1,540,951
281,313
1,577,470
286,658
Total taxes on financial services
12,663,569
11,313,292
12,955,824
11,442,505
18.2 Income tax expense/(reversal)
Accounting policy
Current tax and deferred tax are recognised in the Statement of Profit or Loss except to the extent that it relates to items recognised
directly in equity or in Other Comprehensive Income (OCI).
Current
taxation
Current tax is the expected tax payable or receivable on the taxable income or loss for the year using tax rates enacted or
substantively enacted at the reporting date and any adjustment to tax payable in respect of previous years. The amount of current
tax receivable or payable is the best estimate of the tax amount expected to be paid or received that reflects uncertainty related to
income taxes if any.
Accordingly, provision for taxation is made on the basis of the accounting profit for the year, as adjusted for taxation purposes, in
accordance with the provisions of the Inland Revenue Act, No. 24 of 2017 effective from 1 April 2018, Inland Revenue (Amendment) Act,
No. 10 of 2021, Inland Revenue (Amendment) Act, No. 45 of 2022 and Inland Revenue (Amendment) Act, No. 04 of 2023. As required by
the Sri Lanka Accounting Standard-LKAS 12 - “Income Taxes”, the effective tax rates and reconciliation between the profit before tax and
tax expense is given in Note 18.2.2.
Provision for taxation on the overseas operations is made on the basis of the accounting profit for the year as adjusted for taxation
purposes in accordance with the provisions of the relevant laws and regulations in those countries using the tax rates enacted or
substantively enacted as at the reporting date.
Deferred
taxation
Reconciliation of Deferred tax assets and liabilities on temporary differences is given on Note 37.
18.2.1 Components of income tax expenses
Bank
Group
For the year ended 31 December
Note
2023
2022
2023
2022
LKR ‘000
LKR ‘000
LKR ‘000
LKR ‘000
Current tax expense
Income tax on current year profit
12,328,943
13,403,667
12,961,669
13,627,737
Adjustments in respect of prior years
781,912
146,793
989,298
146,793
Deferred tax expense
Charge/ (reversal) of deferred tax expense
37
538,042
(14,546,219)
204,471
(14,571,046)
Total income tax expense for the year
13,648,897
(995,759)
14,155,438
(796,516)

18.2.2 Reconciliation of accounting profit and income tax expense
Bank
Group
For the year ended 31 December
Note
2023
2022
2023
2022
LKR ‘000
LKR ‘000
LKR ‘000
LKR ‘000
Accounting profit before income tax
40,342,423
30,976,649
41,773,025
31,052,501
Add : Dividend income from subsidiaries and associates
-
-
372,900
107,430
40,342,423
30,976,649
42,145,925
31,159,931
Add : Disallowable expenses
21,841,873
74,023,401
22,268,407
74,916,711
62,184,296
105,000,050
64,414,332
106,076,642
Less: Allowable expenses
5,541,992
27,313,674
5,662,941
27,527,907
Less: Tax exempt income
16,683,203
26,607,014
16,683,203
26,607,015
Taxable income
39,959,101
51,079,362
42,068,188
51,941,720
Taxable income at the rate 30% (2022 - 24% & 30%)
39,959,101
50,561,160
42,068,188
51,292,184
Taxable income at the rate 15% (dividend received)
(2022 - 14% & 15%)
-
518,202
-
649,536
Current tax at rate of 30% (2022 - 24% & 30%)
11,987,730
13,314,547
12,620,456
13,519,805
Tax on dividend received at rate of 15% (2022 - 14% & 15% )
-
75,072
-
93,884
Effect of different tax rates in other countries
341,213
14,048
341,213
14,048
Adjustment in respect of prior years
781,912
146,793
989,298
146,793
Charge/ (reversal) of deferred tax
37
538,042
(14,546,219)
204,471
(14,571,046)
Income tax expense for the year
13,648,897
(995,759)
14,155,438
(796,516)
The effective income tax rate (%)
33.8
(3.2)
33.9
(2.6)
Deferred tax on SLISB ECL
As at 31 December 2023 as disclosed in Note 37, the Bank has recognised a deferred tax asset on the impairment of financial
assets amounting to LKR 20,998.6 million of which LKR 11,667.3 million was judgmentally estimated on the impairment of SLISB
Investments made by the Bank.
18.2.3 The tax liabilities of resident companies are computed at the standard rate of 30% from 1 July 2022 (up to
30 June 2022 : 24%, except the following operations of the bank and subsidiary companies which enjoy full or partial
exemptions and concessions)
For the year ended 31 December
2023
2022
From
01 July 2022
Up to
30 June 2022
%
%
%
Tax rates applicable on local operations
Hotels Colombo (1963) Limited
30.00
30.00
14.00
Ceybank Holiday Homes (Private) Limited
30.00
30.00
14.00
For the year ended 31 December
2023
2022
%
%
Tax rates applicable on foreign operations
Banking operations in Male
25.00
25.00
Banking operations in Chennai
40.00
40.00
Banking operation in Seychelles
Up to SCR 1,000,000
25.00
25.00
Balance
33.33
33.33
Bank of Ceylon (UK) Limited
19.00
19.00
19
Share of profits/ (losses) of associate companies, net of tax
Accounting policy
The aggregate of the Group’s share of profit or losses of associates is shown in the Statement of Profit or Loss under the equity
method of accounting.
Group
For the year ended 31 December
2023
2022
LKR ‘000
LKR ‘000
Ceybank Asset Management Limited
37,681
26,394
Lanka Securities (Private) Limited
(2,056)
70,240
Transnational Lanka Records Solutions (Private) Limited
(2,118)
26,213
Total share of profits/ (losses) of associate companies, net of tax
33,507
122,847
20
Earnings per share and dividend per share
20.1 Basic earnings per share
Accounting policy
In accordance with the Sri Lanka Accounting Standard - LKAS 33 - "Earnings Per Share", basic earning per share is calculated by
dividing the profit or loss attributable to ordinary shareholder of the Bank (the numerator) by the weighted average number of
ordinary shares in issue (the denominator) during the year.
Bank
Group
For the year ended 31 December
Note
2023
2022
2023
2022
Profit attributable to ordinary shareholder of the Bank (LKR '000)
26,693,526
31,972,408
27,571,569
31,994,638
Weighted average number of ordinary shares in issue
20.1.1
25,000,000
25,000,000
25,000,000
25,000,000
Basic earnings per share (LKR)
1,067.74
1,278.90
1,102.86
1,279.79

20.1.1 Weighted average number of ordinary shares in issue
Bank
Group
For the year ended 31 December
2023
2022
2023
2022
Number of ordinary shares in issue as at 01 January
25,000,000
25,000,000
25,000,000
25,000,000
Weighted average number of ordinary shares issued during the year
-
-
-
-
Weighted average number of ordinary shares in issue as
at 31 December
25,000,000
25,000,000
25,000,000
25,000,000
20.2 Diluted earnings per share
Accounting policy
Diluted earnings per share is calculated by dividing the profit or loss attributable to ordinary shareholder of the Bank (the numerator)
by the weighted average number of ordinary shares in issue during the year after adjusting for effect of all dilutive potential ordinary
shares (the denominator).
Bank
Group
For the year ended 31 December
Note
2023
2022
2023
2022
Profit attributable to ordinary shareholder of
the Bank (LKR '000)
26,693,526
31,972,408
27,571,569
31,994,638
Weighted average number of ordinary shares after
adjusting for dilution
20.2.1
25,730,000
25,134,000
25,730,000
25,134,000
Diluted earnings per share (LKR)
1,037.45
1,272.08
1,071.57
1,272.96
20.2.1 Weighted average number of ordinary shares after adjusting for dilution
Bank
Group
For the year ended 31 December
2023
2022
2023
2022
Weighted average number of ordinary shares in issue
25,000,000
25,000,000
25,000,000
25,000,000
Weighted average number of potential ordinary shares under
pending allotment during the year
730,000
134,000
730,000
134,000
Weighted average number of ordinary shares after adjusting for
dilution
25,730,000
25,134,000
25,730,000
25,134,000
20.3 Dividend per share
Accounting policy
Dividend per share is calculated by dividing the total dividend allocated to shareholder (the numerator) by the weighted average
number of ordinary shares in issue (the denominator) during the year.
Bank
Group
For the year ended 31 December
Note
2023
2022
2023
2022
Total dividend allocated to shareholder during
the year (LKR '000)
173,205
346,410
173,205
346,410
Weighted average number of ordinary shares in issue
20.1.1
25,000,000
25,000,000
25,000,000
25,000,000
Dividend per share (LKR)
6.93
13.86
6.93
13.86
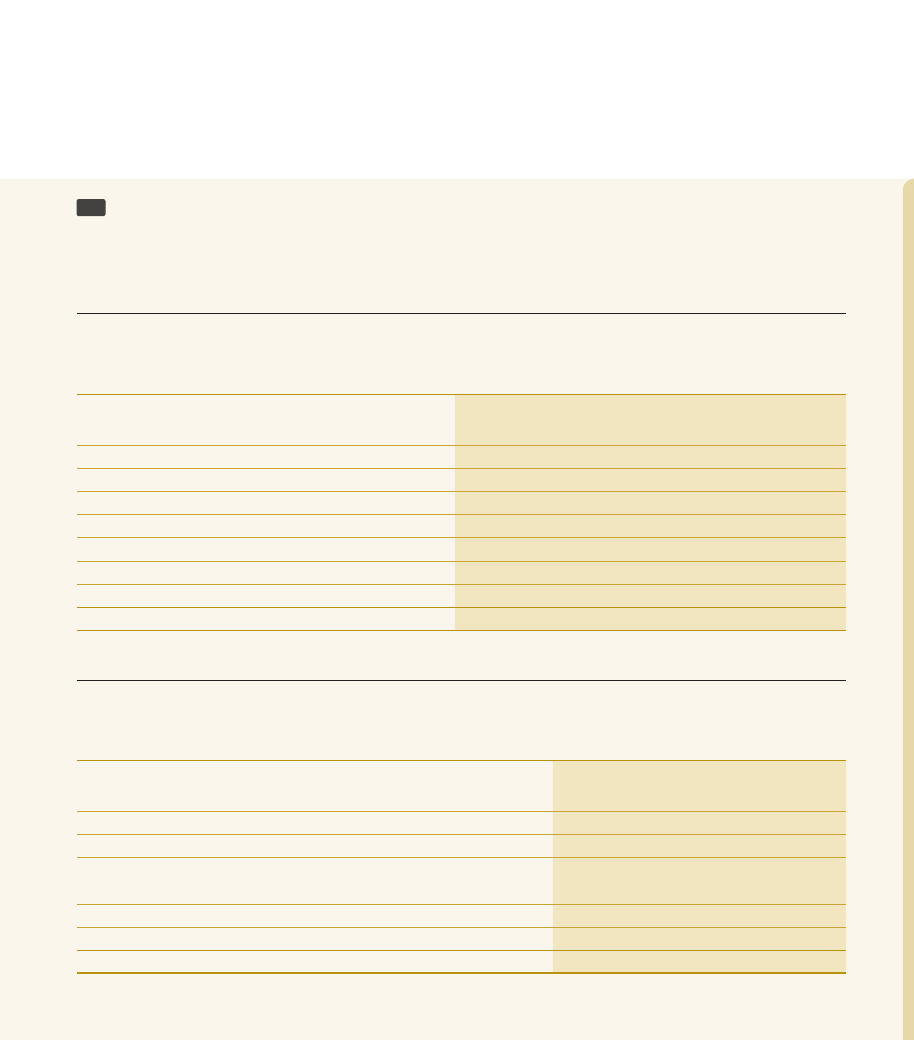
21
Analysis of financial instruments by measurement basis
All financial assets and liabilities are measured under the following headings as per the SLFRS 9 - “Financial Instruments”.
21.1 Bank
As at 31 December
2023
Fair value
through profit
or loss
Fair value
through
OCI
Amortised
cost
Total
LKR ‘000
LKR ‘000
LKR ‘000
LKR ‘000
Financial assets
Cash and cash equivalents
-
-
135,550,505
135,550,505
Balances with Central Banks
-
-
34,932,639
34,932,639
Placements with banks
-
-
74,966,171
74,966,171
Securities purchased under resale agreements
-
-
3,711,918
3,711,918
Derivative financial instruments
20,525,840
-
-
20,525,840
Loans and advances
-
-
2,209,061,924
2,209,061,924
Debt instruments
38,411,078
42,437,931
1,653,728,403
1,734,577,412
Equity instruments
2,231,452
7,096,067
-
9,327,519
Total financial assets
61,168,370
49,533,998
4,111,951,560
4,222,653,928
As at 31 December
2023
Fair value
through profit
or loss
Amortised
cost
Total
LKR ‘000
LKR ‘000
LKR ‘000
Financial liabilities
Due to banks
-
3,047,732
3,047,732
Securities sold under repurchase agreements
-
78,463,070
78,463,070
Derivative financial instruments
2,169,202
-
2,169,202
Financial liabilities at amortised cost
Due to depositors
-
3,882,232,323
3,882,232,323
Other borrowings
-
33,666,236
33,666,236
Subordinated liabilities
-
64,691,810
64,691,810
Total financial liabilities
2,169,202
4,062,101,171
4,064,270,373

As at 31 December
2022
Fair value
through profit
or loss
Fair value
through
OCI
Amortised
cost
Total
LKR ‘000
LKR ‘000
LKR ‘000
LKR ‘000
Financial assets
Cash and cash equivalents
-
-
128,401,532
128,401,532
Balances with Central Banks
-
-
70,494,529
70,494,529
Placements with banks
-
-
16,459,303
16,459,303
Securities purchased under resale agreements
-
-
1,480,403
1,480,403
Derivative financial instruments
57,155,486
-
-
57,155,486
Loans and advances
-
-
2,325,594,329
2,325,594,329
Debt instruments
7,892,241
3,361,267
1,555,897,307
1,567,150,815
Equity instruments
2,387,814
5,329,535
-
7,717,349
Total financial assets
67,435,541
8,690,802
4,098,327,403
4,174,453,746
As at 31 December
2022
Fair value
through profit
or loss
Amortised
cost
Total
LKR ‘000
LKR ‘000
LKR ‘000
Financial liabilities
Due to banks
-
11,514,897
11,514,897
Securities sold under repurchase agreements
-
180,218,543
180,218,543
Derivative financial instruments
921,033
-
921,033
Financial liabilities at amortised cost
Due to depositors
-
3,334,774,261
3,334,774,261
Other borrowings
-
390,489,543
390,489,543
Subordinated liabilities
-
63,758,191
63,758,191
Total financial liabilities
921,033
3,980,755,435
3,981,676,468
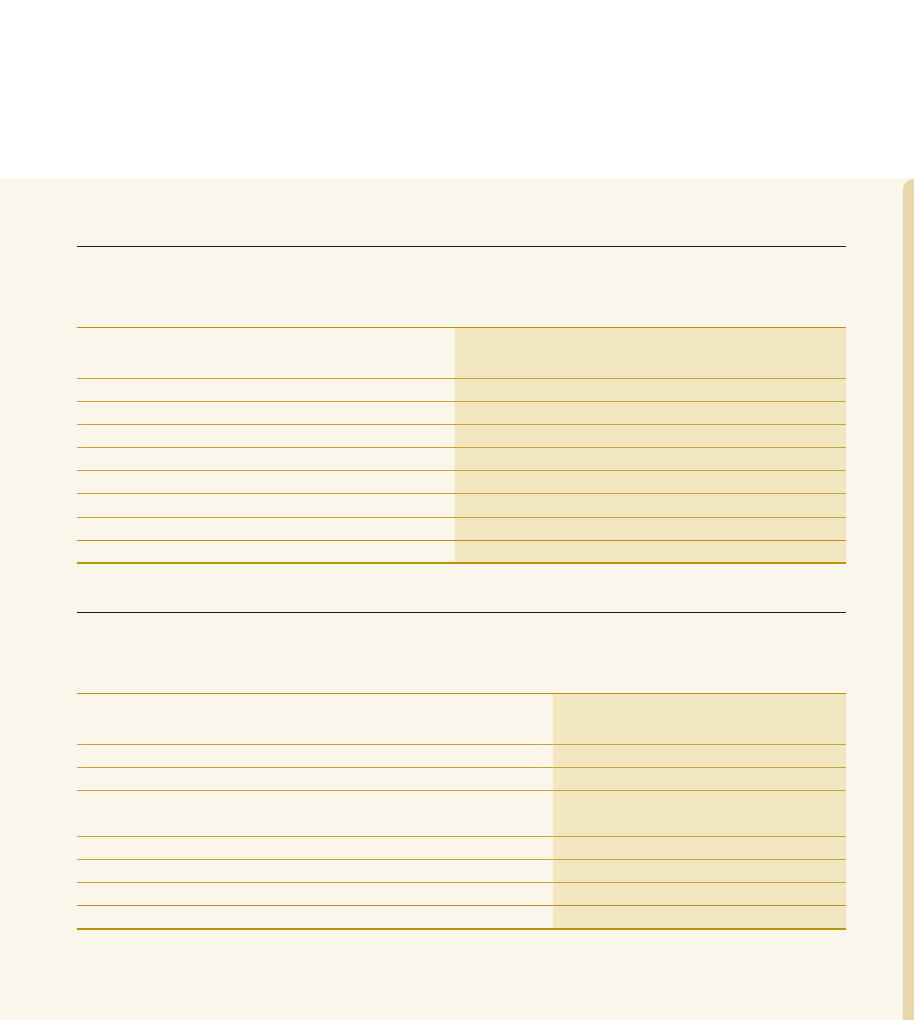
21.2 Group
As at 31 December
2023
Fair value
through profit
or loss
Fair value
through
OCI
Amortised
cost
Total
LKR ‘000
LKR ‘000
LKR ‘000
LKR ‘000
Financial assets
Cash and cash equivalents
-
-
137,369,158
137,369,158
Balances with Central Banks
-
-
34,932,639
34,932,639
Placements with banks
-
-
73,024,979
73,024,979
Securities purchased under resale agreements
-
-
3,695,392
3,695,392
Derivative financial instruments
20,525,840
-
-
20,525,840
Loans and advances
-
-
2,240,611,228
2,240,611,228
Debt instruments
46,236,604
42,524,390
1,660,012,978
1,748,773,972
Equity instruments
2,594,267
9,675,295
-
12,269,562
Total financial assets
69,356,711
52,199,685
4,149,646,374
4,271,202,770
As at 31 December
2023
Fair value
through profit
or loss
Amortised
cost
Total
LKR ‘000
LKR ‘000
LKR ‘000
Financial liabilities
Due to banks
-
3,162,463
3,162,463
Securities sold under repurchase agreements
-
77,829,770
77,829,770
Derivative financial instruments
2,169,202
-
2,169,202
Financial liabilities at amortised cost
Due to depositors
-
3,909,580,686
3,909,580,686
Other borrowings
-
35,592,741
35,592,741
Debt securities issued
-
730,839
730,839
Subordinated liabilities
-
64,437,320
64,437,320
Total financial liabilities
2,169,202
4,091,333,819
4,093,503,021

OVERVIEW
LEADERSHIP
INSIGHTS
OUR
STRATEGY
OUR
PERFORMANCE
STAKEHOLDER
OUTCOMES
GOVERNANCE
FINANCIAL
REPORTS
COMPLIANCE
ANNEXES
SUPPLEMENTARY
INFORMATION
BANK OF CEYLON
A N N U A L R E P O R T 2 0 2 3
208
As at 31 December
2022
Fair value
through profit
or loss
Fair value
through
OCI
Amortised
cost
Total
LKR ‘000
LKR ‘000
LKR ‘000
LKR ‘000
Financial assets
Cash and cash equivalents
-
-
135,230,827
135,230,827
Balances with Central Banks
-
-
70,494,529
70,494,529
Placements with banks
-
-
17,811,665
17,811,665
Securities purchased under resale agreements
-
-
1,463,368
1,463,368
Derivative financial instruments
57,155,486
-
-
57,155,486
Loans and advances
-
-
2,355,978,333
2,355,978,333
Debt instruments
7,954,525
3,361,267
1,562,373,679
1,573,689,471
Equity instruments
2,681,665
7,388,777
-
10,070,442
Total financial assets
67,791,676
10,750,044
4,143,352,401
4,221,894,121
As at 31 December
2022
Fair value
through profit
or loss
Amortised
cost
Total
LKR ‘000
LKR ‘000
LKR ‘000
Financial liabilities
Due to banks
-
11,547,714
11,547,714
Securities sold under repurchase agreements
-
179,938,744
179,938,744
Derivative financial instruments
921,033
-
921,033
Financial liabilities at amortised cost
Due to depositors
-
3,358,198,424
3,358,198,424
Other borrowings
-
397,083,583
397,083,583
Debt securities issued
-
58,807
58,807
Subordinated liabilities
-
63,498,599
63,498,599
Total financial liabilities
921,033
4,010,325,871
4,011,246,904
NOTES TO THE FINANCIAL STATEMENTS
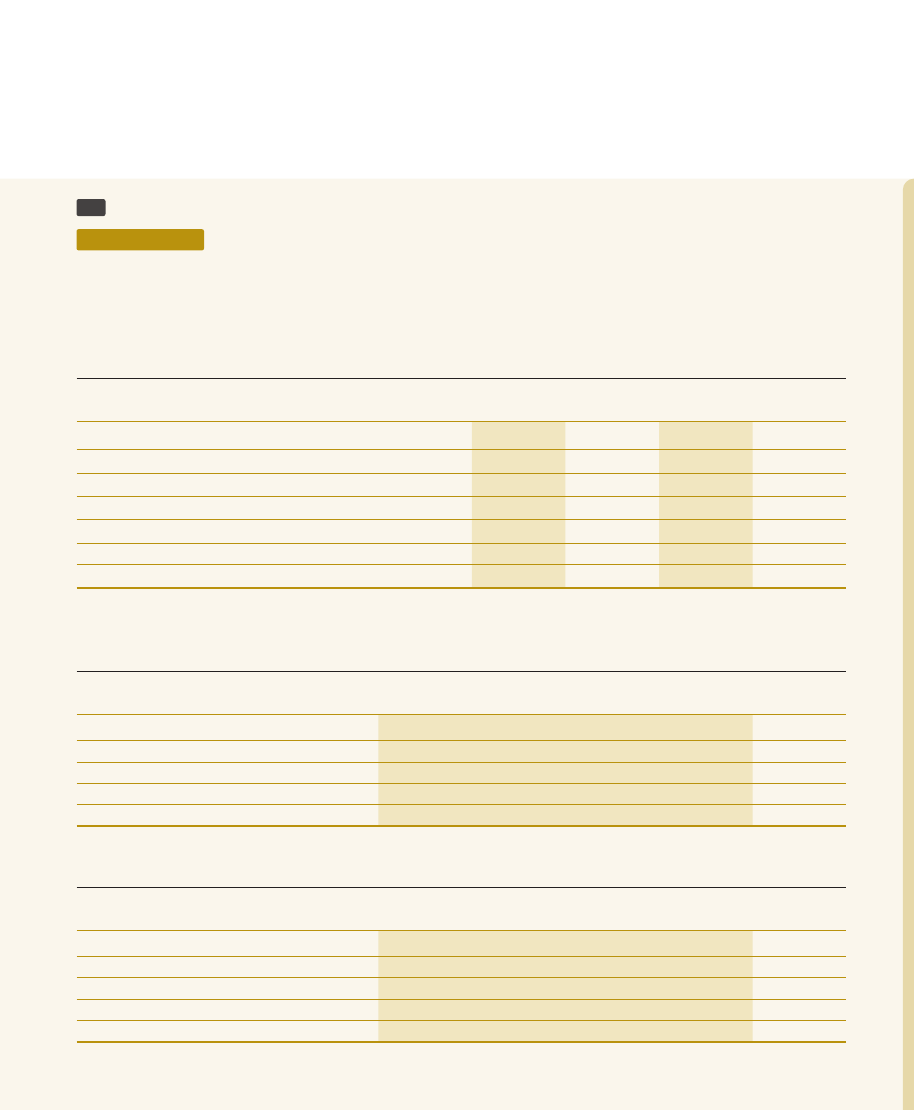
22
Cash and cash equivalents
Accounting policy
Cash and cash equivalents include local and foreign currency notes and coins in hand, unrestricted balances held with central banks,
balances with other banks and highly liquid financial assets with original maturities of less than seven days, which are subject to
insignificant risk of changes in their fair value and are used by the Group to manage its short-term commitments. Cash and cash
equivalents are carried at amortised cost. The losses arising from impairment are recognised in “Impairment charge/ (reversal) for
loans and other losses” (Note 14) in the Statement of Profit or Loss.
Bank
Group
As at 31 December
Note
2023
2022
2023
2022
LKR ‘000
LKR ‘000
LKR ‘000
LKR ‘000
Local currency in hand
58,778,807
52,787,832
59,188,748
53,079,306
Foreign currency in hand
3,854,357
4,903,650
3,869,630
4,903,650
Balances with banks
22,025,466
41,947,117
23,418,948
42,335,121
Money at call and short notice
50,954,466
28,787,088
50,954,466
34,936,920
Gross cash and cash equivalents
135,613,096
128,425,687
137,431,792
135,254,997
Less - Accumulated impairment
22.2
62,591
24,155
62,634
24,170
Net cash and cash equivalents
135,550,505
128,401,532
137,369,158
135,230,827
22.1 Analysis of cash and cash equivalents based on exposure to credit risk
Bank
As at 31 December
2023
2022
Stage 1
Stage 2
Stage 3
Total
Total
LKR ‘000
LKR ‘000
LKR ‘000
LKR ‘000
LKR ‘000
Balances with banks
22,025,466
-
-
22,025,466
41,947,117
Money at call and short notice
50,954,466
-
-
50,954,466
28,787,088
72,979,932
-
-
72,979,932
70,734,205
Less - Accumulated impairment
62,591
-
-
62,591
24,155
Net cash equivalents
72,917,341
-
-
72,917,341
70,710,050
Group
As at 31 December
2023
2022
Stage 1
Stage 2
Stage 3
Total
Total
LKR ‘000
LKR ‘000
LKR ‘000
LKR ‘000
LKR ‘000
Balances with banks
23,418,948
-
-
23,418,948
42,335,121
Money at call and short notice
50,954,466
-
-
50,954,466
34,936,920
74,373,414
-
-
74,373,414
77,272,041
Less - Accumulated impairment
62,634
-
-
62,634
24,170
Net cash equivalents
74,310,780
-
-
74,310,780
77,247,871
22.2 Movement in provision for impairment during the year
Bank
Group
2023
2022
2023
2022
LKR ‘000
LKR ‘000
LKR ‘000
LKR ‘000
Movement in Stage 1 impariment
Balance as at 1 January
24,155
12,203
24,170
13,814
Charge/(write back) to income statement
38,436
11,952
38,436
10,356
Other movements
-
-
28
-
Balance as at 31 December
62,591
24,155
62,634
24,170
Bank
Group
2023
2022
2023
2022
LKR ‘000
LKR ‘000
LKR ‘000
LKR ‘000
Movement in total impariment
Balance as at 1 January
24,155
12,203
24,170
13,814
Charge/(write back) to income statement
38,436
11,952
38,436
10,356
Other movements
-
-
28
-
Balance as at 31 December
62,591
24,155
62,634
24,170
23
Balances with Central Banks
Accounting policy
Balances with Central Banks are carried at amortised cost in the Statement of Financial Position
Bank
Group
As at 31 December
2023
2022
2023
2022
LKR ‘000
LKR ‘000
LKR ‘000
LKR ‘000
Statutory balances with Central Banks
Central Bank of Sri Lanka
25,082,652
63,270,482
25,082,652
63,270,482
Other Central Banks
9,849,987
7,224,047
9,849,987
7,224,047
Total balances with Central Banks
34,932,639
70,494,529
34,932,639
70,494,529
23.1 Central Bank of Sri Lanka (CBSL)
In terms of the provisions of Section 93 of the Monetary Law Act No. 58 of 1949, the Bank is required to maintain a cash reserve with
Central Bank of Sri Lanka. The minimum cash reserve requirement as of 31 December 2023 was 2.0% (2022 - 4.0%) of Sri Lankan
Rupee deposit liabilities. There is no reserve requirement for foreign currency deposit liabilities maintained by domestic branches and
the deposit liabilities of the Off-shore Banking Division in Sri Lanka (2022 - Nil).
23.2 Reserve Bank of India (RBI)
In terms of the provisions of Section 42 (1) of the Reserve Bank of India (RBI) Act No. 02 of 1934, the branch in Chennai is required
to maintain a cash reserve with RBI. The minimum cash reserve as of 31 December 2023 was 4.5% on its demand and term deposit
liabilities. (2022 - 4.5%)
23.3 Maldives Monetary Authority (MMA)
In accordance with the prevailing regulations of Maldives Monetary Authority (MMA), the branch in Maldives is required to maintain a
reserve deposit based on 10.0% of the branch’s commercial deposits and liabilities to the public in the Maldives in Maldivian Rufiyaa
and 10.0% of the branch’s commercial deposits and liabilities to the public in the Maldives in United States Dollar. (2022 - 10.0% for
Maldivian Rufiyaa and 10.0% for United States Dollar seperately)
NOTES TO THE FINANCIAL STATEMENTS
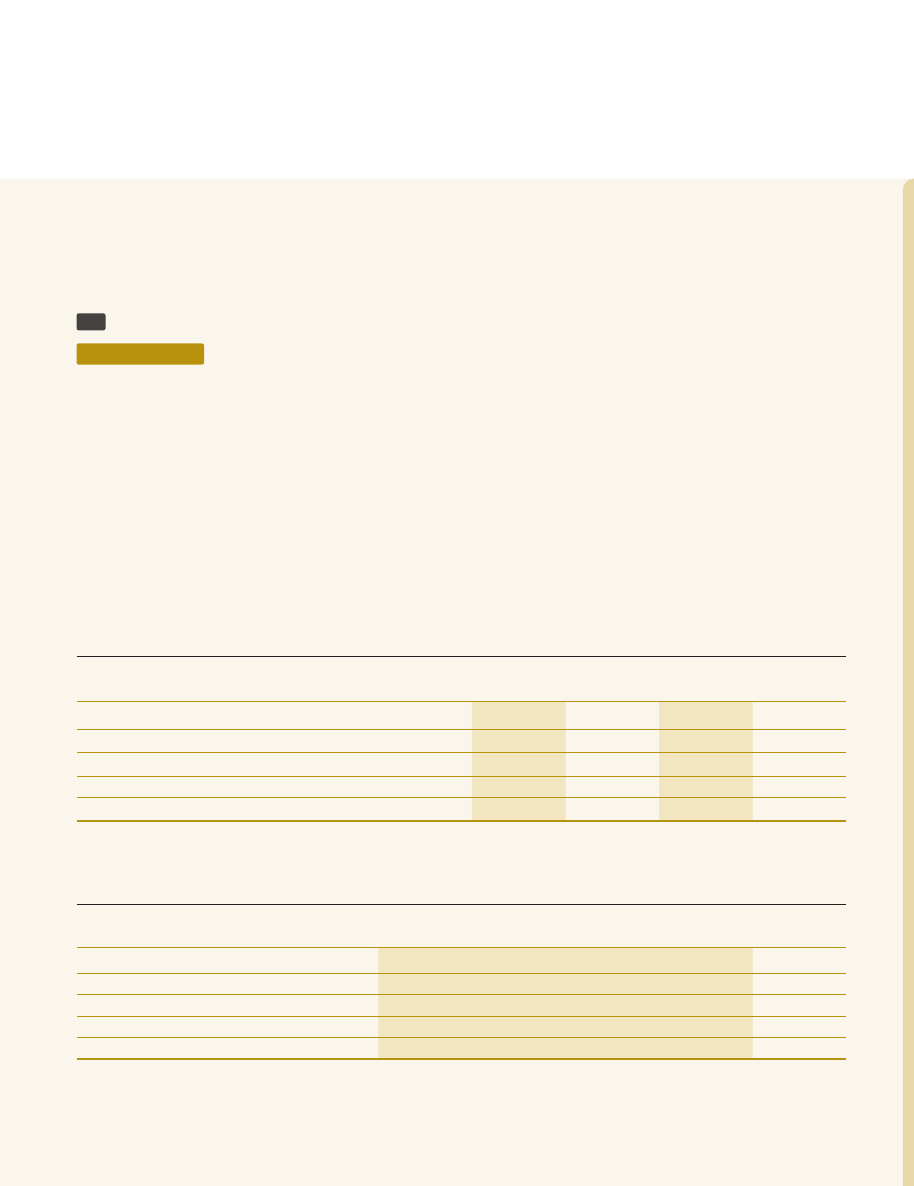
23.4 Central Bank of Seychelles (CBS)
In accordance with the regulations of Central Bank of Seychelles, the branch in Seychelles is required to maintain a reserve deposit
based on 13.0% on Seychelles rupee deposits of the branch’s commercial deposits liabilities to the public in Seychelles and 13.0%
for foreign currency deposits of the branch’s commercial deposits liabilities to the public in Seychelles. (2022 - 13.0% for Seychelles
Rupee and 13.0% for foreign currency deposits).
24
Placements with banks
Accounting policy
Placements with banks include balances with other banks with original maturities of more than seven days which are non-derivative
financial assets with fixed or determinable payments that are not quoted in an active market, other than:
• Those that intends to sell immediately or in the near term and those that the Bank, upon initial recognition, designates as at fair
value through profit or loss
• Those that upon initial recognition, designates as fair value through other comprehensive income
• Those for which may not recover substantially all of its initial investment, other than due to credit deterioration
Placement with banks are initially measured at fair value. After initial measurement, they are subsequently measured at amortised
cost using the Effective Interest Rate (EIR), less allowance for impairment. Interest income from placement with banks is included in
“Interest income” (Note 8.1) in the Statement of Profit or Loss. The losses arising from impairment are recognised in “Impairment
charge/ (reversal) for loans and other losses” (Note 14) in the Statement of Profit or Loss. Certain placements with banks are written
off when they are determined to be uncollectible.
Bank
Group
As at 31 December
Note
2023
2022
2023
2022
LKR ‘000
LKR ‘000
LKR ‘000
LKR ‘000
Within Sri Lanka
2,381,765
680,503
2,381,765
784,185
Outside Sri Lanka
72,629,185
16,098,749
70,687,993
17,347,429
Gross placements with banks
75,010,950
16,779,252
73,069,758
18,131,614
Less - Accumulated impairment
24.2
44,779
319,949
44,779
319,949
Net placements with banks
74,966,171
16,459,303
73,024,979
17,811,665
24.1 Analysis of placements with banks based on exposure to credit risk
Bank
As at 31 December
2023
2022
Stage 1
Stage 2
Stage 3
Total
Total
LKR ‘000
LKR ‘000
LKR ‘000
LKR ‘000
LKR ‘000
Within Sri Lanka
2,381,765
-
-
2,381,765
680,503
Outside Sri Lanka
72,629,185
-
-
72,629,185
16,098,749
75,010,950
-
-
75,010,950
16,779,252
Less - Accumulated impairment
44,779
-
-
44,779
319,949
Net placements with banks
74,966,171
-
-
74,966,171
16,459,303
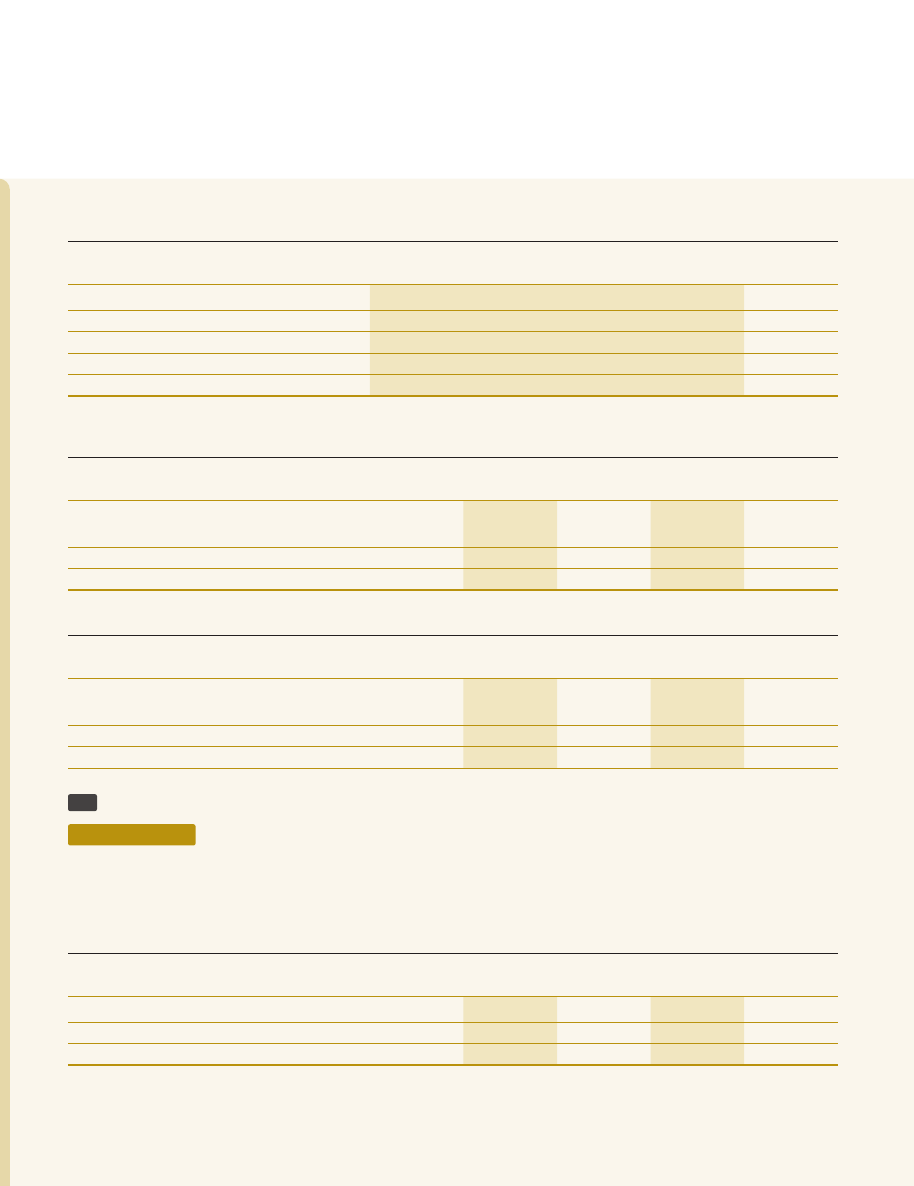
Group
As at 31 December
2023
2022
Stage 1
Stage 2
Stage 3
Total
Total
LKR ‘000
LKR ‘000
LKR ‘000
LKR ‘000
LKR ‘000
Within Sri Lanka
2,381,765
-
-
2,381,765
784,185
Outside Sri Lanka
70,687,993
-
-
70,687,993
17,347,429
73,069,758
-
-
73,069,758
18,131,614
Less - Accumulated impairment
44,779
-
-
44,779
319,949
Net placements with banks
73,024,979
-
-
73,024,979
17,811,665
24.2 Movement in provision for impairment during the year
Bank
Group
2023
2022
2023
2022
LKR ‘000
LKR ‘000
LKR ‘000
LKR ‘000
Movement in Stage 1 impairment
Balance as at 1st January
319,949
533
319,949
2,601
Charge/ (reversal) during the year
(275,170)
319,416
(275,170)
317,348
Balance as at 31 December
44,779
319,949
44,779
319,949
Bank
Group
2023
2022
2023
2022
LKR ‘000
LKR ‘000
LKR ‘000
LKR ‘000
Movement in total Impairment
Balance as at 1st January
319,949
533
319,949
2,601
Charge/ (reversal) during the year
(275,170)
319,416
(275,170)
317,348
Balance as at 31 December
44,779
319,949
44,779
319,949
25
Securities purchased under resale agreements
Accounting policy
Securities purchased under resale agreements (reverse repos) are purchased with an agreement to sell them at a higher price at
a specific future date. The consideration paid and accrued interest (measured by using the EIR) are recorded in the Statement of
Financial Position, reflecting the transaction’s economic substance as an advance granted by the Group. The difference between the
purchase price and resale price is recognised as ”Interest income” (Note 8.1) and is amortised over the life of the agreement.
Bank
Group
As at 31 December
2023
2022
2023
2022
LKR ‘000
LKR ‘000
LKR ‘000
LKR ‘000
With banks
1,699,302
1,480,403
1,682,776
1,463,368
With customers
2,012,616
-
2,012,616
-
Total securities purchased under resale agreements
3,711,918
1,480,403
3,695,392
1,463,368
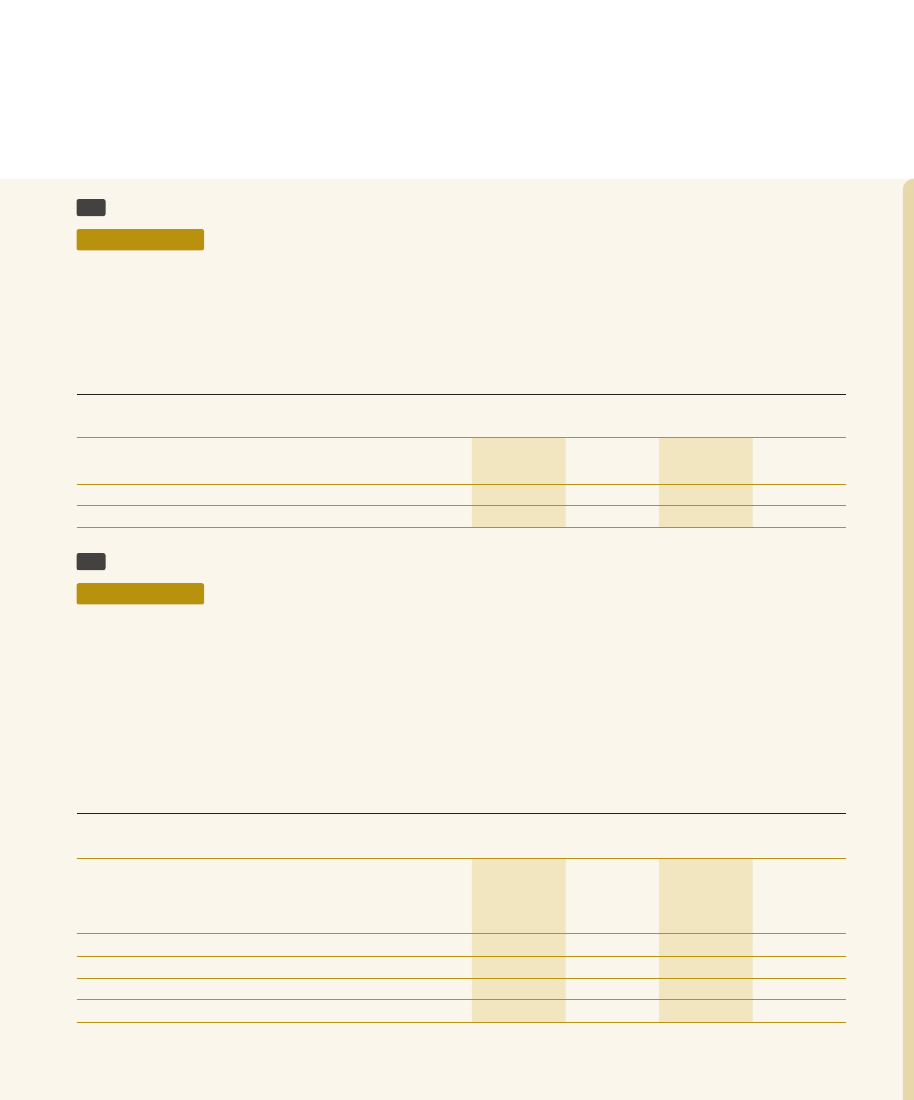
26
Derivative financial instruments
Accounting policy
Derivatives are financial instruments that derive their value in response to changes in interest rates, financial instrument prices,
commodity prices, foreign exchange rates, credit risk, indices etc. Derivatives are categorised as trading unless they are designated
as hedging instruments. All derivatives are initially recognised and subsequently measured at fair value, with all revaluation gains
or losses recognised in the Statement of Profit or Loss under “Net gains/ (losses) from trading “ (Note 10). Derivatives are recorded
at fair value and carried as assets when their fair value is positive and as liabilities when their fair value is negative. Fair value is
determined using the forward market rates ruling on the reporting date.
Bank
Group
As at 31 December
2023
2022
2023
2022
LKR ‘000
LKR ‘000
LKR ‘000
LKR ‘000
Foreign currency derivatives
Forward exchange contracts
4,415,152
3,045
4,415,152
3,045
Currency SWAPs
16,110,688
57,152,441
16,110,688
57,152,441
Total derivative financial instruments
20,525,840
57,155,486
20,525,840
57,155,486
27
Financial assets recognised through profit or loss - measured at fair value
Accounting policy
Financial instruments are classified as financial assets measured at fair value through profit or loss if they have been acquired
principally for the purpose of selling or repurchasing in the near term or holds as a part of a portfolio that is managed together for
short term profit or position taking. Further as per SLFRS 9 - “Financial Instruments” financial assets recognised through profit or loss
includes all financial assets other than those classified under FVTOCI and amortised cost.
All financial assets under this category are initially and subsequently measured at fair value. Upon initial recognition, transaction cost
are directly attributable to the acquisition are recognised in the Statement of Profit or Loss. Interest income is recorded in “Interest
income” (Note 8.1) according to the terms of the contract. Dividend are recognised in “Net gains/ (losses) from trading” (Note 10).
Changes in fair value are recognised in “Net fair value gains/ (losses) from financial instruments at fair value through profit or loss”
(Note 11).
Bank
Group
As at 31 December
Note
2023
2022
2023
2022
LKR ‘000
LKR ‘000
LKR ‘000
LKR ‘000
Measured at fair value
Sri Lanka Government Securities
Treasury bills
33,975,090
3,408,566
33,975,090
3,408,566
Treasury bonds
69,691
459,119
7,876,803
459,119
Quoted equities
27.2
2,231,452
2,387,814
2,594,267
2,681,665
Units in unit trusts
27.3
4,366,297
4,024,556
4,384,711
4,086,840
Financial assets recognised through profit or loss
40,642,530
10,280,055
48,830,871
10,636,190

27.1 By currency
Bank
Group
As at 31 December
2023
2022
2023
2022
LKR ‘000
LKR ‘000
LKR ‘000
LKR ‘000
Sri Lankan Rupee
40,642,530
10,280,055
48,830,871
10,636,190
Total
40,642,530
10,280,055
48,830,871
10,636,190
27.2 Quoted equities
27.2.1 Sector wise composition of quoted equities
Bank
As at 31 December
2023
2022
Sector
Cost of
investment
Market
Value
Sector wise
composition
of market
value
Cost of
investment
Market
Value
Sector wise
composition
of market
value
LKR ‘000
LKR ‘000
%
LKR ‘000
LKR ‘000
%
Banks
4,273
3,588
0.2
9,902
5,253
0.2
Capital goods
1,160,694
874,072
39.2
1,551,926
1,085,204
45.4
Consumer durables and apparel
123,565
87,847
3.9
144,930
87,402
3.7
Consumer services
668,914
374,801
16.8
697,470
312,240
13.1
Diversified financials
136,633
53,203
2.4
107,566
23,524
1.0
Energy
70,259
40,408
1.8
142,739
34,547
1.4
Food and staples retailing
-
-
-
23,200
23,475
1.0
Food, beverage and tobacco
483,623
328,790
14.7
554,882
319,510
13.4
Materials
366,257
219,266
9.8
423,762
225,475
9.4
Real estate
20,981
14,367
0.6
20,981
14,271
0.6
Retailing
160,669
83,406
3.7
160,669
92,487
3.9
Telecommunication services
7,496
19,881
0.9
7,496
14,552
0.6
Transportation
200,963
87,719
3.9
200,963
111,601
4.7
Utilities
62,026
44,104
2.1
62,026
38,273
1.6
Quoted equity bank [Note 27.2.2]
3,466,353
2,231,452
100.0
4,108,512
2,387,814
100.0

Group
As at 31 December
2023
2022
Sector
Cost of
investment
Market
Value
Sector wise
composition
of market
value
Cost of
investment
Market
Value
Sector wise
composition
of market
value
LKR ‘000
LKR ‘000
%
LKR ‘000
LKR ‘000
%
Banks
4,543
3,823
0.1
9,902
5,253
0.2
Capital goods
1,320,944
973,116
37.5
1,681,285
1,153,085
43.0
Commercial & professional services
2,468
1,892
0.1
693
512
0.0
Consumer durables and apparel
136,306
95,568
3.7
154,544
92,873
3.5
Consumer services
749,472
444,827
17.1
767,267
365,083
13.6
Diversified financials
214,330
90,430
3.5
185,302
61,155
2.3
Diversified holdings
4,621
3,892
0.2
-
-
-
Energy
70,259
40,408
1.6
144,615
35,633
1.3
Food and staples retailing
1,601
1,226
0.0
24,562
24,458
0.9
Food,beverage and tobacco
571,953
370,293
14.3
621,800
361,749
13.5
Health care equipment and services
2,351
2,110
0.1
669
526
0.0
Insurance
5,633
3,725
0.1
10,683
11,232
0.4
Materials
429,421
264,083
10.2
472,128
252,995
9.4
Real estate
41,085
25,415
1.0
40,412
24,700
0.9
Retailing
168,092
88,129
3.4
166,860
96,396
3.6
Software and services
1,362
748
0.0
1,277
1,020
0.0
Telecommunication services
7,496
19,881
0.8
7,496
14,552
0.5
Transportation
217,899
97,459
3.8
217,454
123,536
4.6
Utilities
87,945
67,242
2.6
85,618
56,907
2.1
Quoted equity group [Note 27.2.3]
4,037,781
2,594,267
100.0
4,592,567
2,681,665
100.0

27.2.2 Quoted equities-Bank
Bank
As at 31 December
2023
2022
Number of
ordinary
shares
Cost of
investment
Market
price per
share
Market
value
Number of
ordinary
shares
Cost of
investment
Market
price per
share
Market
value
LKR '000
LKR
LKR '000
LKR '000
LKR
LKR '000
Banks
Hatton National Bank PLC
-
-
-
-
66,584
9,902
78.90
5,253
Seylan Bank PLC - Non - Voting
101,073
4,273
35.50
3,588
-
-
-
-
Total of bank sector
4,273
3,588
9,902
5,253
Capital goods
Access Engineering PLC
2,326,286
72,603
20.30
47,224
2,376,286
74,164
10.70
25,426
Aitken Spence PLC
766,150
75,749
116.00
88,873
2,050,067
202,690
128.00
262,409
Brown & Company PLC
234,241
38,480
100.00
23,424
234,241
38,480
118.00
27,640
Central Industries PLC
66,598
6,828
87.30
5,814
-
-
-
-
Colombo Dockyard PLC
797,625
179,456
50.50
40,280
897,625
201,955
59.00
52,960
Hayleys PLC
373,839
37,383
71.40
26,692
250,000
25,956
68.00
17,000
Hemas Holdings
1,127,296
99,068
66.70
75,191
1,127,296
99,068
56.40
63,579
John Keells Holdings PLC
2,465,472
412,087
191.00
470,905
4,088,677
683,389
135.25
552,994
Lanka Walltile PLC
249,735
12,313
42.20
10,539
-
-
-
-
Lankem Ceylon PLC
72,400
32,702
64.50
4,670
72,400
32,702
91.20
6,603
Renuka Holdings PLC
1,287,089
40,626
12.70
16,346
1,255,887
40,123
13.80
17,331
Royal Ceramics Lanka PLC
850,000
64,218
26.40
22,440
850,000
64,218
28.30
24,055
The Colombo Fort Land & Building PLC
149,500
10,307
30.90
4,620
149,500
10,307
28.30
4,231
UNISYST Engineering PLC
1,673,758
27,116
5.80
9,708
1,673,758
27,116
5.70
9,540
Vallibel One PLC
712,143
51,758
38.40
27,346
712,143
51,758
30.10
21,436
Total of capital goods sector
1,160,694
874,072
1,551,926
1,085,204
Consumer durables and apparel
Ambeon Holdings PLC
385,000
23,273
34.50
13,283
385,000
23,273
35.30
13,591
Hayleys Fabric PLC
505,325
21,138
40.50
20,466
1,259,527
49,543
22.60
28,465
Hela Apparel Holdings PLC
548,400
8,226
5.00
2,742
548,400
8,226
8.50
4,661
Regnis Lanka PLC
300,000
25,500
39.90
11,970
300,000
25,500
42.10
12,630
Teejay Lanka PLC
1,085,000
45,428
36.30
39,386
885,000
38,388
31.70
28,055
Total of consumer durables and
apparel sector
123,565
87,847
144,930
87,402
Consumer services
Asian Hotels and Properties PLC
2,367,741
225,788
58.00
137,329
2,367,741
225,788
37.40
88,554
Aitken Spence Hotel Holdings PLC
2,527,424
230,843
63.00
159,228
2,547,424
232,670
50.80
129,409
Citrus Leisure PLC
100,000
10,112
5.60
560
100,000
10,112
6.00
600
Eden Hotel Lanka PLC
775,550
41,864
10.10
7,833
775,550
41,864
17.60
13,650
Hayleys Leisure PLC
686,139
30,665
21.00
14,409
1,186,240
53,020
21.10
25,030
Tal Lanka Hotels PLC
387,400
26,014
19.00
7,361
447,400
30,043
16.40
7,337
Tangerine Beach Hotels PLC
50,000
5,056
52.50
2,625
50,000
5,056
59.10
2,955
The Fortress Resorts PLC
1,451,100
50,165
18.50
26,845
1,461,100
50,510
15.90
23,231
Trans Asia Hotels PLC
477,200
48,407
39.00
18,611
477,200
48,407
45.00
21,474
Total of consumer services sector
668,914
374,801
697,470
312,240

Bank
As at 31 December
2023
2022
Number of
ordinary
shares
Cost of
investment
Market
price per
share
Market
value
Number of
ordinary
shares
Cost of
investment
Market
price per
share
Market
value
LKR '000
LKR
LKR '000
LKR '000
LKR
LKR '000
Diversified financials
Ceylon Guardian Investment Trust PLC
107,248
32,506
83.30
8,934
107,248
32,506
62.80
6,735
Ceylon Investment PLC
538,124
75,061
45.00
24,216
538,124
75,060
31.20
16,789
Commercial Credit and Finance PLC
300,000
10,244
29.10
8,730
-
-
-
-
First Capital Holdings PLC
157,382
7,785
28.10
4,422
-
-
-
-
First Capital Treasuries PLC
274,936
11,037
25.10
6,901
-
-
-
-
Total of diversified financials sector
136,633
53,203
107,566
23,524
Energy
Laugfs Gas PLC - Non-voting
1,683,646
70,259
24.00
40,408
3,420,538
142,739
10.10
34,547
Total of energy sector
70,259
40,408
142,739
34,547
Food and staples retailing
Cargills (Ceylon) PLC
-
-
-
-
100,000
23,200
234.75
23,475
Total of food and staples retailing sector
-
-
23,200
23,475
Food, beverage and tobacco
Bukit Darah PLC
69,257
48,762
385.00
26,664
119,257
83,965
291.75
34,793
Carson Cumberbatch PLC
313,352
141,328
242.25
75,910
313,352
141,328
269.75
84,527
Ceylon Tobacco Company PLC
141,887
135,865
953.75
135,325
143,175
137,098
625.00
89,484
Horana Plantations PLC
465,700
39,720
41.70
19,420
465,700
39,720
61.90
28,827
Kahawatte Plantations PLC
371,164
15,014
16.00
5,939
371,164
15,013
24.50
9,094
Kotagala Plantations PLC
729,997
34,709
6.20
4,526
729,997
34,709
7.70
5,621
Lucky Lanka Milk Processing PLC -
Non-voting
-
-
-
-
91,900
276
0.80
74
Lucky Lanka Milk Processing PLC - Voting
-
-
-
-
1,000,000
6,000
1.10
1,100
Melstacorp PLC
-
-
-
-
713,504
41,825
46.20
32,964
Sunshine Holdings PLC
1,196,198
68,225
51.00
61,006
949,010
54,948
34.80
33,026
Total of food, beverage and
tobacco sector
483,623
328,790
554,882
319,510
Materials
Alumex PLC
2,254,360
34,864
8.10
18,260
2,254,360
34,864
7.20
16,231
Chemanex PLC
118,179
18,563
68.60
8,107
118,179
18,563
72.00
8,509
Chevron Lubricants Lanka PLC
1,272,121
161,138
90.30
114,873
1,272,121
161,138
96.50
122,760
CIC Holdings PLC - Non-voting
110,200
6,071
42.50
4,684
-
-
-
-
Dipped Products PLC
676,913
39,302
27.90
18,886
676,913
39,302
29.10
19,698
Lanka Cement PLC
-
-
-
-
7,265,828
63,576
2.50
18,165
Swisstek (Ceylon) PLC
567,798
26,441
15.60
8,858
567,798
26,441
15.70
8,914
Tokyo Cement Co Ltd
1,199,941
79,878
38.00
45,598
1,199,941
79,878
26.00
31,198
Total of materials sector
366,257
219,266
423,762
225,475

Bank
As at 31 December
2023
2022
Number of
ordinary
shares
Cost of
investment
Market
price per
share
Market
value
Number of
ordinary
shares
Cost of
investment
Market
price per
share
Market
value
LKR '000
LKR
LKR '000
LKR '000
LKR
LKR '000
Real estate
Overseas Realty (Ceylon) PLC
957,794
20,981
15.00
14,367
957,794
20,981
14.90
14,271
Total of real estate sector
20,981
14,367
20,981
14,271
Retailing
Diesel and Motor Engineering PLC
61,054
63,661
511.50
31,229
61,054
63,661
599.00
36,571
Hunters & Company PLC
17,989
14,552
611.25
10,996
17,989
14,552
707.00
12,718
John Keells PLC
250,200
22,758
64.20
16,063
250,200
22,758
65.10
16,288
Odel PLC
222,295
9,325
14.00
3,112
222,295
9,325
17.30
3,846
R I L Property PLC
2,478,566
34,176
5.10
12,641
2,478,566
34,176
5.70
14,128
Sathosa Motors PLC
13,194
5,111
188.00
2,480
13,194
5,111
130.25
1,719
United Motors Lanka PLC
118,500
11,086
58.10
6,885
118,500
11,086
60.90
7,217
Total of retailing sector
160,669
83,406
160,669
92,487
Telecommunication services
Sri Lanka Telecom PLC
214,000
7,496
92.90
19,881
214,000
7,496
68.00
14,552
Total of telecommunication services
sector
7,496
19,881
7,496
14,552
Transportation
Expolanka Holdings PLC
612,352
200,963
143.25
87,719
612,352
200,963
182.25
111,601
Total of transportation sector
200,963
87,719
200,963
111,601
Utilities
Laugfs Power PLC - Non -voting
947,089
-
7.80
7,387
1,297,831
-
6.80
8,825
Panasian Power PLC
1,029,200
6,402
3.40
3,499
1,029,200
6,402
3.40
3,499
Resus Energy PLC
1,066,031
37,729
15.00
15,990
1,066,031
37,729
11.80
12,579
Windforce PLC
897,300
17,895
19.20
17,228
897,300
17,895
14.90
13,370
Total of utilities sector
62,026
44,104
62,026
38,273
Total quoted equities
3,466,353
2,231,452
4,108,512
2,387,814

27.2.3 Quoted equities - Group
Group
As at 31 December
2023
2022
Number of
ordinary
shares
Cost of
investment
Market
price per
share
Market
value
Number of
ordinary
shares
Cost of
investment
Market
price per
share
Market
value
LKR '000
LKR
LKR '000
LKR '000
LKR
LKR '000
Banks
Amana Bank PLC
102,124
270
2.30
235
-
-
-
-
Hatton National Bank PLC
-
-
-
-
66,584
9,902
78.90
5,253
Seylan banks PLC - Non - Voting
101,073
4,273
35.50
3,588
-
-
-
-
Total of banks sector
4,543
3,823
9,902
5,253
Capital goods
Access Engineering PLC
2,989,254
92,315
20.30
60,682
2,851,278
90,552
10.70
30,509
ACL Cables PLC
123,750
10,507
68.80
8,514
54,000
4,980
70.10
3,785
Aitken Spence PLC
766,150
75,749
116.00
88,873
2,050,067
202,690
128.00
262,409
Alpha Fire Service PLC
21,224
732
35.90
762
-
-
-
-
Brown and Company PLC
350,737
69,817
100.00
35,074
331,079
67,958
118.00
39,067
Central Industries PLC
71,908
7,325
87.30
6,278
10,000
949
58.00
580
Colombo Dockyard PLC
847,625
183,952
50.50
42,805
947,625
206,451
59.00
55,910
E B Creasy & Company PLC
25,000
785
22.70
568
5,000
285
20.60
103
Hayleys PLC
602,614
57,487
71.40
43,027
324,275
33,113
68.00
22,051
Hemas Holdings PLC
1,279,311
111,507
66.70
85,330
1,212,811
106,862
56.40
68,403
John Keells Holdings PLC
2,486,843
415,431
191.00
474,987
4,152,544
693,008
135.25
561,632
Kelani Cables PLC
250
110
244.00
61
250
110
259.76
65
Lanka Tiles PLC
7,500
734
42.20
317
7,500
734
46.10
346
Lanka Walltiles PLC
249,735
12,313
42.20
10,539
-
-
-
-
Lankem Ceylon PLC
85,900
33,954
64.50
5,541
72,400
32,702
91.20
6,603
Mackwoods Energy PLC
1,350,000
4,194
1.80
2,430
1,200,000
3,848
2.50
3,000
MTD Walkers PLC
165,000
6,751
-
-
165,000
6,751
-
-
Renuka Holdings PLC
2,128,811
55,900
12.70
27,036
2,077,204
55,101
13.80
28,665
Renuka Holdings PLC -Non-voting
127
2
10.79
1
156
2
12.80
2
Richard Pieris and Company PLC
-
-
-
-
60,000
1,609
24.10
1,446
Royal Ceramics Lanka PLC
1,032,000
74,742
26.40
27,245
1,032,000
74,742
28.30
29,206
The Colombo Fort Land & Building PLC
149,500
10,307
30.90
4,620
149,500
10,307
28.30
4,231
Unisyst Engineering PLC
1,808,758
27,985
5.80
10,491
1,673,758
27,116
5.70
9,540
Vallibel One PLC
987,883
68,345
38.40
37,935
848,223
61,415
30.10
25,532
Total of capital goods sector
1,320,944
973,116
1,681,285
1,153,085

Group
As at 31 December
2023
2022
Number of
ordinary
shares
Cost of
investment
Market
price per
share
Market
value
Number of
ordinary
shares
Cost of
investment
Market
price per
share
Market
value
LKR '000
LKR
LKR '000
LKR '000
LKR
LKR '000
Commercial and professional services
E M L Consultants PLC
556,585
2,468
3.40
1,892
131,352
693
3.90
512
Total of commercial and professional services
2,468
1,892
693
512
Consumer durables and apparel
Ambeon Capital PLC
500,000
5,035
7.40
3,700
80,000
1,004
9.90
792
Ambeon Holdings PLC
420,000
24,587
34.50
14,490
385,000
23,273
35.30
13,591
Blue Diamonds Jewellery Worldwide
PLC-Non-voting
5,250,000
3,125
0.20
1,050
5,250,000
3,125
0.30
1,575
Hayleys Fabric PLC
505,325
21,138
40.50
20,466
1,359,527
53,472
22.60
30,725
Hela Apparel Holdings PLC
891,354
11,419
5.00
4,457
641,354
9,708
8.50
5,452
Regnis Lanka PLC
300,000
25,500
39.90
11,970
300,000
25,500
42.10
12,630
Singer Industries (Ceylon) PLC
1,486
74
33.00
49
1,486
74
35.90
53
Teejay Lanka PLC
1,085,000
45,428
36.30
39,386
885,000
38,388
31.70
28,055
Total of consumer durables and
apparel sector
136,306
95,568
154,544
92,873
Consumer services
Aitken Spence Hotel Holdings PLC
2,528,424
230,903
63.00
159,291
2,547,424
232,670
50.80
129,409
Anilana Hotels & Properties PLC
750,000
1,106
0.90
675
750,000
1,106
0.90
675
Asian Hotels and Properties PLC
2,367,741
225,788
58.00
137,329
2,367,741
225,788
37.40
88,554
Beruwala Resorts PLC
948,739
1,378
1.10
1,044
250,000
350
1.20
300
Browns Beach Hotel PLC
-
-
-
-
10,000
135
12.70
127
Citrus Leisure PLC
461,086
12,791
5.60
2,582
251,086
11,310
6.00
1,507
Eden Hotel Lanka PLC
953,293
46,402
10.10
9,628
903,293
45,541
17.60
15,898
Galadari Hotels (Lanka) PLC
25,000
356
16.00
400
50,000
724
12.50
625
Hayleys Leisure PLC
764,005
32,501
21.00
16,044
1,254,106
54,708
21.10
26,462
Hikkaduwa Beach Resort PLC
294,353
1,852
5.20
1,531
194,353
1,252
5.00
972
Mahaweli Reach Hotels PLC
50,000
724
12.20
610
-
-
-
-
Marawila Resorts PLC
260,000
702
2.60
676
-
-
-
-
Palm Garden Hotels PLC
37,500
2,489
41.20
1,545
35,000
2,341
55.30
1,936
Renuka City Hotels PLC
200
72
350.25
70
-
-
-
-
Renuka Hotels PLC
5,000
480
83.70
419
-
-
-
-
Serendib Hotels PLC
25,000
378
12.50
313
-
-
-
-
Tal Lanka Hotels PLC
404,129
26,380
19.00
7,678
447,400
30,043
16.40
7,337
Tangerine Beach Hotels PLC
61,500
5,848
52.50
3,229
52,500
5,256
59.10
3,103
The Fortress Resorts PLC
1,451,100
50,165
18.50
26,845
1,461,100
50,510
15.90
23,231
The Kandy Hotels Company (1938) PLC
140,006
1,285
8.40
1,176
215,006
1,972
7.20
1,548
The Kingsbury PLC
3,875,454
41,834
10.80
41,855
3,875,454
41,834
8.50
32,941
The Lighthouse Hotel PLC
124,467
4,704
31.50
3,921
124,467
4,704
30.00
3,734
Trans Asia Hotels PLC
477,200
48,407
39.00
18,611
477,200
48,407
45.00
21,474
Waskaduwa Beach Resort PLC
3,598,067
12,927
2.60
9,355
2,100,000
8,616
2.50
5,250
Total of consumer services sector
749,472
444,827
767,267
365,083

Group
As at 31 December
2023
2022
Number of
ordinary
shares
Cost of
investment
Market
price per
share
Market
value
Number of
ordinary
shares
Cost of
investment
Market
price per
share
Market
value
LKR '000
LKR
LKR '000
LKR '000
LKR
LKR '000
Diversified financials
Asia Asset Finance PLC
-
-
-
-
399,999
4,056
7.70
3,080
Asia Siyaka Commodities PLC
20,000
90
4.10
82
-
-
-
-
Associated Motor Finance Company PLC
-
-
-
-
50,000
643
8.10
405
Capital Alliance PLC
-
-
-
-
30,000
669
19.90
597
Central Finance Company PLC
-
-
-
-
73,205
8,172
62.50
4,575
Ceylon Guardian Investment Trust PLC
107,248
32,506
83.30
8,934
107,248
32,506
62.80
6,735
Ceylon Investment PLC
610,489
82,008
45.00
27,472
603,169
81,740
31.20
18,819
Commercial Credit and Finance PLC
300,000
10,244
29.10
8,730
-
-
-
-
First Capital Holdings PLC
162,382
7,951
28.10
4,563
10,000
260
22.90
229
First Capital Treasuries PLC
274,936
11,037
25.10
6,901
-
-
-
-
Galle Face Capital Partners PLC
19,269
1,006
25.60
493
32,500
1,026
16.10
523
Guardian Capital Parteners PLC
-
-
-
-
18,472
1,006
16.10
297
HNB Finance PLC
42,500
355
5.20
221
25,000
259
4.20
105
Lanka Credit & Business Finance PLC
986,561
3,802
1.70
1,677
836,561
3,408
2.30
1,924
LB Finance PLC
40,000
2,947
62.30
2,492
25,000
1,867
40.00
1,000
LOLC Finance PLC
978,277
17,284
4.60
4,500
898,277
16,758
8.20
7,366
LOLC Holdings PLC
57,030
35,667
355.25
20,260
25,346
20,293
398.00
10,088
People's Leasing & Finance PLC
90,424
976
10.70
968
477,768
5,186
5.00
2,389
Shaw Wallace Investments PLC
14,115
172
8.10
114
20,213
238
7.10
144
SMB Finance PLC
1,337,753
1,070
0.60
803
-
-
-
-
SMB Finance PLC-Non-voting
5,000,000
3,000
0.30
1,500
5,000,000
3,000
0.30
1,500
Softlogic Finance PLC
122,056
4,215
5.90
720
122,056
4,215
11.30
1,379
Total of diversified financials sector
214,330
90,430
185,302
61,155
Diversified holdings
Richard Pieris & Company PLC
189,854
4,621
20.50
3,892
-
-
-
-
Total of diversified holdings sector
4,621
3,892
-
-
Energy
Laugfs Gas PLC - Non-voting
1,683,646
70,259
24.00
40,408
3,528,038
144,615
10.10
35,633
Total of energy sector
70,259
40,408
144,615
35,633
Food and staples retailing
Cargills (Ceylon) PLC
-
-
-
-
100,000
23,200
234.75
23,475
Tess Agro PLC
783,224
1,098
1.10
862
733,224
1,048
1.10
807
Tess Agro PLC-Non-voting
520,353
503
0.70
364
220,353
314
0.80
176
Total of food and staples retailing sector
1,601
1,226
24,562
24,458

Group
As at 31 December
2023
2022
Number of
ordinary
shares
Cost of
investment
Market
price per
share
Market
value
Number of
ordinary
shares
Cost of
investment
Market
price per
share
Market
value
LKR '000
LKR
LKR '000
LKR '000
LKR
LKR '000
Food, beverage and tobacco
Agalawatte Plantations PLC
178,500
8,919
32.60
5,819
147,500
7,895
31.90
4,705
Browns Investments PLC
4,075,000
40,827
4.70
19,153
2,440,262
29,811
7.00
17,082
Bukit Darah PLC
69,257
48,762
385.00
26,664
119,257
83,965
291.75
34,793
Carson Cumberbatch PLC
313,352
141,328
242.25
75,910
313,352
141,328
269.75
84,527
Ceylon Cold Stores PLC
243,008
14,871
42.40
10,304
187,000
12,200
36.90
6,900
Ceylon Tobacco Company PLC
141,887
135,865
953.75
135,325
143,175
137,098
625.00
89,484
Distilleries Company of Sri Lanka PLC
-
-
-
-
75,000
1,512
13.20
990
Elpitiya Plantations PLC
3,830
396
85.00
326
3,830
396
86.00
329
Horana Plantations PLC
465,700
39,720
41.70
19,420
465,700
39,720
61.90
28,827
HVA Foods PLC
160,000
1,286
3.80
608
160,000
1,342
3.70
592
Kahawatte Plantations PLC
376,164
15,109
16.00
6,019
371,164
15,013
24.50
9,094
Kotagala Plantations PLC
889,997
35,924
6.20
5,518
764,997
35,014
7.70
5,890
Kotmale Holdings PLC
2,296
952
390.00
895
2,296
952
386.25
887
Lucky Lanka Milk Processing PLC -
Non-voting
2,514,546
14,958
-
-
91,900
276
0.80
74
Lucky Lanka Milk Processing PLC - Voting
-
-
-
-
1,000,000
6,000
1.10
1,100
Melstacorp PLC
-
-
-
-
893,504
51,679
46.20
41,280
Raigam Wayamba Salterns PLC
34,249
266
6.30
216
50,000
391
5.80
290
Renuka Agri Foods PLC
797,356
4,545
3.90
3,110
210,000
1,436
5.60
1,176
Sunshine Holdings PLC
1,196,198
68,225
51.00
61,006
969,221
55,772
34.80
33,729
Total of food, beverage and tobacco
sector
571,953
370,293
621,800
361,749
Health care equipment and services
Asiri Hospital Holdings PLC
5,000
210
24.60
123
5,000
210
25.70
129
Asiri Surgical Hospital PLC
124,860
1,685
12.90
1,611
25,000
387
13.00
325
E - Channelling PLC
24,000
384
14.00
336
-
-
-
-
Nawaloka Hospitals PLC
10,000
72
4.00
40
10,000
72
7.20
72
Total of health care equipment and
services sector
2,351
2,110
669
526
Insurance
Arpico Insurance PLC
10,000
300
22.50
225
10,000
300
22.70
227
Co-Operative Insurance Company PLC
75,000
254
2.40
180
-
-
-
-
Janashakthi Insurance Company PLC
-
-
-
-
14,634
480
31.70
464
Softlogic Capital PLC
370,000
3,894
6.50
2,405
1,035,000
9,843
10.10
10,454
Softlogic Life Insurance PLC
17,000
1,185
53.80
915
1,000
60
86.60
87
Total of insurance sector
5,633
3,725
10,683
11,232

Group
As at 31 December
2023
2022
Number of
ordinary
shares
Cost of
investment
Market
price per
share
Market
value
Number of
ordinary
shares
Cost of
investment
Market
price per
share
Market
value
LKR '000
LKR
LKR '000
LKR '000
LKR
LKR '000
Materials
Agstar PLC
110,000
1,107
8.50
935
-
-
-
-
Alumex PLC
2,986,628
43,412
8.10
24,192
2,914,070
42,790
7.20
20,981
Bogala Graphite Lanka PLC
44,002
3,423
50.00
2,200
39,002
3,099
45.80
1,786
Chemanex PLC
118,179
18,563
68.60
8,107
118,179
18,563
72.00
8,509
Chevron Lubricants Lanka PLC
1,416,521
175,563
90.30
127,912
1,341,521
168,708
96.50
129,457
CIC Holdings PLC-Non-voting
165,200
9,093
42.50
7,021
5,000
368
55.60
278
Dipped Products PLC
957,435
53,997
27.90
26,712
841,913
49,954
29.10
24,500
Ex-Pack Corrugated Cartons PLC
52,820
767
12.40
655
47,500
752
13.10
622
Haycarb PLC
59,500
5,623
64.30
3,826
57,500
5,503
57.60
3,312
Industrial Asphalts (Ceylon) PLC
750,000
275
0.40
300
500,000
200
0.30
150
JAT Holdings PLC
75,000
1,374
15.30
1,148
25,000
574
12.40
310
Lanka Cement PLC
-
-
-
-
7,265,828
63,576
2.50
18,165
Pelwatte Sugar Industries PLC
41,600
1,799
-
-
68,400
2,925
-
-
Richered Peries Export PLC
1,700
1,029
484.50
824
-
-
-
-
Swisstek (Ceylon) PLC
567,798
26,441
15.60
8,858
567,798
26,441
15.70
8,914
Tokyo Cement Co Ltd
1,199,941
79,878
38.00
45,598
1,285,043
83,390
26.00
33,411
Tokyo Cement Company (Lanka) PLC-
Non-voting
152,500
7,077
38.00
5,795
100,000
5,285
26.00
2,600
Total of materials sector
429,421
264,083
472,128
252,995
Real estate
Colombo Land and Development
Company PLC
82,639
2,849
17.00
1,405
77,639
2,756
15.70
1,219
East West Properties PLC
585,000
6,793
7.40
4,329
500,000
6,014
8.00
4,000
Lanka Realty Investments PLC
261,876
6,148
10.60
2,776
245,000
5,881
10.10
2,475
Millennium Housing Developers PLC
10,000
36
2.90
29
-
-
-
-
Overseas Realty (Ceylon) PLC
957,794
20,981
15.00
14,367
996,735
21,577
14.90
14,851
Prime Lands Residencies PLC
150,000
1,995
6.50
975
150,000
1,995
6.50
975
Seylan Developments PLC
106,500
2,283
14.40
1,534
100,000
2,189
11.80
1,180
Total of real estate sector
41,085
25,415
40,412
24,700

Group
As at 31 December
2023
2022
Number of
ordinary
shares
Cost of
investment
Market
price per
share
Market
value
Number of
ordinary
shares
Cost of
investment
Market
price per
share
Market
value
LKR '000
LKR
LKR '000
LKR '000
LKR
LKR '000
Retailing
Ceylon Tea Brokers PLC
-
-
-
-
35,000
176
4.20
147
Diesel and Motor Engineering PLC
61,054
63,661
511.50
31,229
61,054
63,661
599.00
36,571
Hunters and Company PLC
17,989
14,552
611.25
10,996
17,989
14,552
707.00
12,718
John Keells PLC
276,198
24,687
64.20
17,732
276,198
24,687
65.10
17,980
Odel PLC
222,295
9,325
14.00
3,112
222,295
9,325
17.30
3,846
R I L Property PLC
2,958,566
38,828
5.10
15,089
2,818,566
37,987
5.70
16,066
Sathosa Motors PLC
13,194
5,111
188.00
2,480
13,194
5,111
130.25
1,719
Singer (Sri Lanka) PLC
50,526
842
12.00
606
15,751
275
8.40
132
United Motors Lanka PLC
118,500
11,086
58.10
6,885
118,500
11,086
60.90
7,217
Total of retailing sector
168,092
88,129
166,860
96,396
Software and services
hSenid Business Solutions PLC
65,000
1,362
11.50
748
60,000
1,277
17.00
1,020
Total of software and services
1,362
748
1,277
1,020
Telecommunication services
Sri Lanka Telecom PLC
214,000
7,496
92.90
19,881
214,000
7,496
68.00
14,552
Total of telecommunication services
sector
7,496
19,881
7,496
14,552
Transportation
Expolanka Holdings PLC
680,339
217,899
143.25
97,459
677,839
217,454
182.25
123,536
Total of transportation sector
217,899
97,459
217,454
123,536
Utilities
Laugfs Power PLC - Non-voting
1,024,938
714
7.80
7,995
1,375,680
714
6.80
9,355
Lotus Hydro Power PLC
21,240
183
8.80
187
-
-
-
-
LVL Energy Fund PLC
250,000
1,750
5.50
1,375
-
-
-
-
Panasian Power PLC
1,279,200
7,660
3.40
4,349
1,279,200
7,661
3.40
4,349
Resus Energy PLC
1,321,002
41,136
15.00
19,815
1,321,031
41,136
11.80
15,588
Vallibel Power Erathna PLC
716,322
4,966
7.20
5,158
750,000
5,205
6.30
4,725
Vidullanka PLC
1,550,000
12,519
6.70
10,385
1,450,000
11,885
6.10
8,845
Vidullanka PLC-Non-voting
150,000
1,122
5.00
750
150,000
1,122
4.50
675
Windforce PLC
897,300
17,895
19.20
17,228
897,300
17,895
14.90
13,370
Total of utilities sector
87,945
67,242
85,618
56,907
Total quoted equities
4,037,781
2,594,267
4,592,567
2,681,665

27.3 Units in unit trusts
As at 31 December
2023
2022
Number of
units
Cost of
investment
Market
value
Number of
units
Cost of
investment
Market
value
LKR '000
LKR '000
LKR '000
LKR '000
Bank
Ceybank Unit Trust
111,307,627
1,738,215
3,662,021
111,307,627
1,738,215
3,432,727
Ceybank Century Growth Fund
7,539,256
132,952
704,167
7,539,256
132,952
591,756
Ceybank Surekum Gilt Edged Fund
4,921
50
109
4,921
50
73
Total units in unit trusts
1,871,217
4,366,297
1,871,217
4,024,556
Group
Ceybank Unit Trust
111,307,627
1,738,215
3,662,021
111,307,627
1,738,215
3,432,727
Ceybank Century Growth Fund
7,539,256
132,952
704,167
7,539,256
132,952
591,756
Ceybank Surekum Gilt Edged Fund
4,921
50
109
4,921
50
73
Comtrust Money Market Fund
313,271
2,777
5,197
313,271
2,777
4,186
First Capital Asset Management
Limited
8,179
9,112
13,217
8,179
9,112
8,736
First Capital Money Market Fund
-
-
-
21,207
31,666
49,362
Total units in unit trusts
1,883,106
4,384,711
1,914,772
4,086,840
28
Financial assets at amortised cost - loans and advances
Accounting policy
Loans and advances include non-derivative financial assets with fixed or determinable payments that are not quoted in an active
market, other than
• Those that the Bank intends to sell immediately or in the near term and those that the Bank, upon initial recognition, designates
as at fair value through profit or loss
• Those that the Bank, upon initial recognition, designates as fair value through OCI
• Those for which the Bank may not recover substantially all of its initial investment, other than due to credit deterioration
“Loans and advances” are initially measured at fair value and subsequently measured at amortised cost using the Effective Interest
Rate (EIR), less allowance for impairment. Amortised cost is calculated by taking into account any discount or premium on acquisition
and fees and costs that are an integral part of the EIR. The amortisation is included in “Interest income”(Note 8.1) in the Statement of
Profit or Loss. The losses arising from impairment are recognised in “Impairment charge/(reversal) for loans and other losses” (Note
14) in the Statement of Profit or Loss.
Write-off
of
loans
and
receivables;
Loans together with the associated allowance are written off when there is no realistic prospect of future recovery and all collateral
has been realised . If a write-off is later recovered, the recovery is recognised in the “Net other operating income” (Note 13).
Collateral
valuation
The Group seeks to use collateral, where possible, to mitigate its risks on financial assets. The collateral comes in various forms such
as cash, gold, securities, letters of credit/guarantees, real estate, inventories, other non-financial assets and credit enhancements such
as netting arrangements. The fair value of collateral is generally assessed, at a minimum, at inception and based on the guidelines
issued by Central Bank of Sri Lanka, there on.

Non-financial collaterals, including immovable and movables, are valued based on data provided by the independent professional and Audited Financial Statements.
valuers and Audited Financial Statements.
Collaterals repossessed
The Group’s policy is to dispose of repossessed properties through parate execution or fiscal conveys (Foreclosed properties) in an
orderly fashion. The proceeds are used to reduce or repay the outstanding claim. In general, the Group does not occupy repossessed
properties for business use.
Renegotiated loans (restructured or rescheduled)
Where possible, the Group seeks to renegotiate loans rather than take possession of collateral. This may involve extending the
payment arrangements and agreement of new loan conditions. Once the terms have been renegotiated, any impairment is measured
using the original EIR as calculated before the modification of terms. The management continously reviews renegotiated loans to
ensure that all criteria are met and that future payments are likely to occur. The loans continue to be subject to an individual or
collective impairment assessment. Further the Bank may consider modifications for original terms and conditions to retain customer,
support customer or/ and expansions.
Expected credit loss (ECL)
The Bank’s impairment provisioning method has fundamentaly changed due to the adoption of SLFRS 9 - “Financial Instruments” by
replacing LKAS 39 - “Financial Instruments: Recognition and Measurement” incurred loss approach with forward looking expected
loss approach as mentioned in Note 4.4.11 to this Financial Statements. Accordingly, the Bank has recorded an expected credit loss
allowance for all loans and other debt financial assets except which are held at FVPL, together with loan commitments and financial
guarantee contracts which are commonly referred to as “financial instruments”.
The ECL allowance is based on the credit losses expected to arise over the life of the asset, the Lifetime Expected Credit Loss (LTECL)
as outlined in Notes 4.4.11.2 and 4.4.11.3, if there has been no significant increase in credit risk since origination, in which case, the
allowance is based on the 12 months’ expected credit loss (12mECL) as outlined in Note 4.4.11.1 to the Financial Statements. The
Bank’s policies for determining whether there has been a significant increase in credit risk are set out in this note.
Both LTECLs and 12mECLs are calculated either on an individual basis or on collective basis, depending on the nature and size of the
underlying portfolio of financial instruments. The Bank’s policy for grouping financial instruments measured on a collective basis is
explained in Note 4.4.11.5.
The Bank has established a policy to perform an assessment, at the end of each reporting period, of whether a financial instrument’s
credit risk has increased significantly since initial recognition, by considering the change in the risk of default occurring over the
remaining life of the financial instrument.
Based on the above process, the Bank grouped its loans into Stage 1, Stage 2 and Stage 3 as described in Note 4.4.11.1 to 4.4.11.3
to this Financial Statements.
For financial assets in respect of which the Bank has no reasonable expectations of recovering either the entire outstanding amount,
or a proportion thereof, the gross carrying amount of the financial asset is reduced.
The componenets of the ECL calculation is outlined under Note 4.4.11.4 to this Financial Statements and when estimating the ECLs,
the Bank considers three economic scenarios (base case, best case and worst case). Each of these scenarios are associated with
different loss rates.
For all products the Bank considers the maximum period over which the credit losses are determined is the contractual life of a
financial instrument.
Impairment losses and reversals are accounted for and disclosed separately from modification losses or gains that are accounted for
as an adjustment of the financial asset’s gross carrying value.
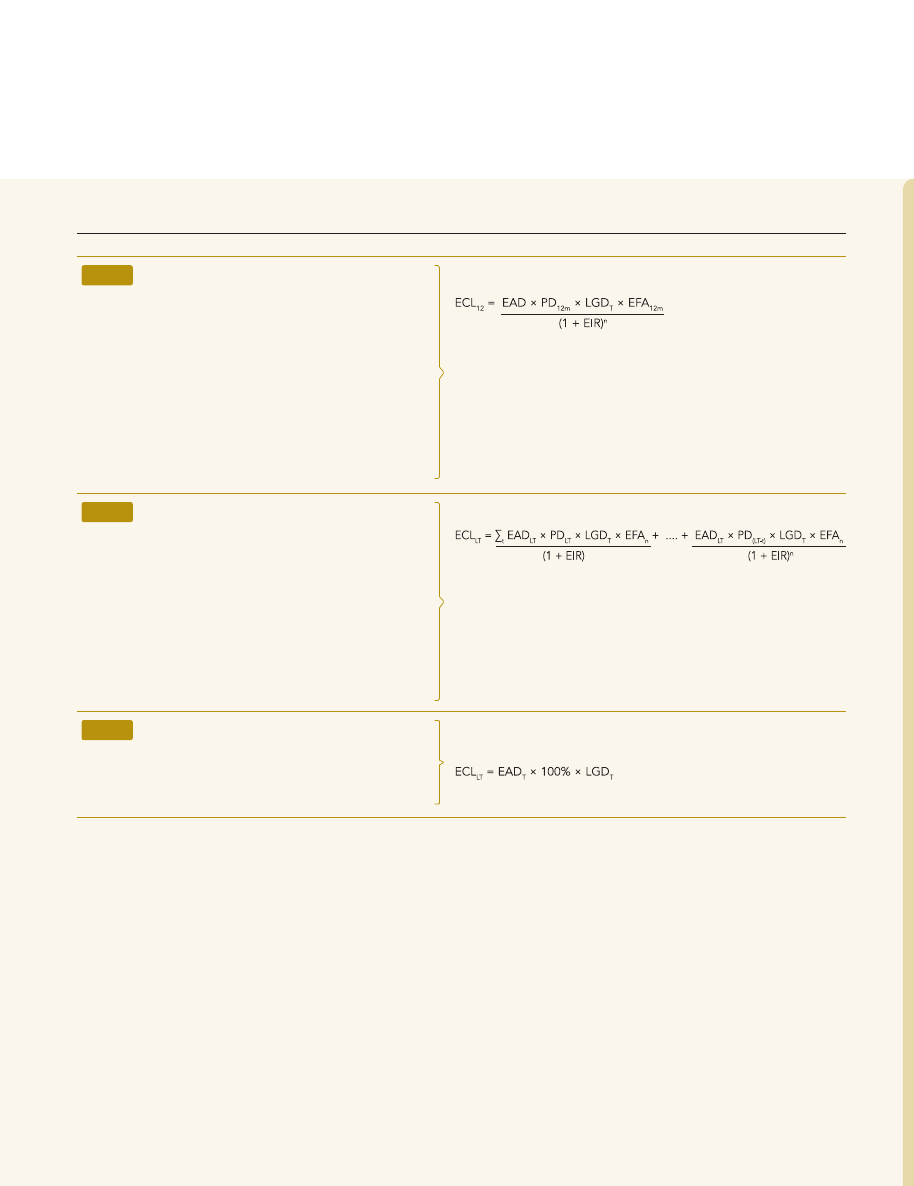
The methodology used for calculation of the ECL are summarised below:
Stage
Classification criteria
ECL measurement
Stage 1
Includes financial assets that have not had a
significant increase in credit risk since initial
recognition or that have low credit risk at the
reporting date. For these financial assets,
12mECLs are recognised i.e. the expected
credit losses which result from default events
that are possible within 12 months after the
reporting date. It is not the expected cash
shortfalls over the 12-month period but the
entire credit loss on an asset weighted by the
probability that the loss will occur in the next
12 months.
12 months’ expected credit loss
Stage 2
Includes financial assets that have had a
significant increase in credit risk since initial
recognition but that do not have objective
evidence of impairment. For these assets,
LTECLs are recognised. LTECLs are the
expected credit losses that result from all
possible default events over the remaining
maturity period of the loan from the reporting
date. Expected credit losses are the weighted
average credit losses with the probability of
default (“PD”) as the weight.
Life time expected credit loss
Stage 3
Includes financial assets that have objective
evidence of impairment at the reporting date
which shows a significant credit risk. Lifetime
ECLs are recognised based on the 100%
probability.
Life time expected credit loss with probability of default at
100%.
Loan
commitments
When estimating ECLs for undrawn loan commitments, the Bank estimates the expected portion of the loan commitment that will be
drawn down over its expected life. The ECL is then based on the present value of the expected shortfalls in cash flows if the loan is
drawn down, based on a probability-weighting of the three scenarios. The expected cash shortfalls are discounted at an approximation
to the expected EIR on the loan. For credit cards and revolving facilities, that include both a loan and an undrawn commitment, ECLs
are calculated and presented together with the loan and loan commitments.
Financial
guarantee
contracts
The Bank's liability under each guarantee is measured at the higher of the amount initially recognised less cumulative amortisation
recognised in the statement of profit or loss, and the ECL provision. For this purpose, the Bank estimates ECLs based on the present
value of the expected payments to reimburse the holder for a credit loss that it incurs. The shortfalls are discounted by the risk adjusted
interest rate relevant to the exposure. The calculation is made using a probability-weighting of the three scenarios.

Revolving
facilities
The Bank’s product offering includes a variety of corporate and retail facilities, in which the Bank has the right to cancel and/or
reduce the facilities with one day’s notice (eg: Overdraft and Credit Card). The Bank does not limit its exposure to credit losses to the
contractual notice period, but, instead calculates ECL over a period that reflects the Bank’s expectations of the customer behaviour,
its likelihood of default and the Bank’s future risk mitigation procedures, which could include reducing or cancelling the facilities.
The ongoing assessment of whether a significant increase in credit risk has occurred for revolving facilities is similar to other lending
products. This is based on shifts in the customer’s delinquency.
The calculation of ECLs, including the estimation of the expected period of exposure and discount rate is made on an individual
basis for individually significant loans and on a collective basis for other loans. The collective assessments are made separately for
portfolios of facilities with similar homogeneous characteristics.
Forward looking information
In its ECL models, the Bank relies on a broad range of forward looking information as economic inputs, such as:
• GDP growth
• Interest rate
• Inflation
• Exchange rate
• Unemployment rates
• Status of the industry business
• Regulatory impact
•
Government
policies
Impairment assessment
Definition of default and upgrade
The Bank considers a financial instrument defaulted and therefore assessed in Stage 3 (as credit-impaired) for ECL calculations in all
cases when the borrower becomes 90 days past due on its contractual payments or the credit facility/ customer is classified as a non
performing advance in accordance with CBSL directions.
As a part of a qualitative assessment of whether a customer is in default, the Bank also considers a variety of instances that may
indicate unlikeliness to pay. When such events occur, the Bank carefully considers whether the event should result in treating the
customer as defaulted and therefore assessed as Stage 3 for ECL calculations or whether Stage 2 is appropriate. Such events include:
• Credit rating of a borrower has been subsequently downgraded to B+ or below under the Sri Lankan National Rating scale by
External Credit Assessment Institution (EACI)
• A two -notch downgrade under the Bank's internal rating
• Reasonable and supportable forecasts of future economic conditions show a direct negative on the future performance of a
customer/group of customers.
• A significant change in the geographical locations or natural catastrophes that directly impact the performance of a customer/
group of customers.
• The value of collateral is significantly reduced and /or realisability of collateral is doubtful.
• Frequent changes in the Board of Directors and Senior Management of an institutional customer.
• Delay in commencement of business operations/projects by more than two years from the originally agreed date.
• Modification of terms resulting in concessions, including extensions, deferment of payments, waiver of covenants and other
restructuring of credit facilities.
• A fall of 50% or more in the turnover and / or profit before tax of the borrower when compared to the previous year for two
consecutive years and /or erosion of net-worth of the borrower by more than 25% (other than due to changes in equity structure
and dividend policy) when compared to the previous financial year, and reduction will effect to the settlement of future contractual
payments.
NOTES TO THE FINANCIAL STATEMENTS

• The borrower is subject to litigation that significantly affects the performance of the credit facility
• Unable to contact or find the borrower
• Claims made under obligation of Letter of Guarantee
• The borrower is deceased / insolvent
• Any other criteria that, materially impacted for recoverability.
It is the Bank’s policy to consider a financial instrument as “upgraded” and therefore re-classified out of Stage 3 when none of the
default criteria is no longer present. The decision whether to classify an asset as Stage 2 or Stage 1 once upgraded depends on
the updated credit grade, at the time of the upgrade, and whether there has been a significant increase in credit risk compared to
initial recognition. Further restructured facilities are considered as “upgraded” once a satisfactory performing period of a minimum
90 days subsequent to the first capital and/ or interest installment post-restructure is in place, while upgrading of rescheduled
facilities,branch/business unit should obtain the approval from the Chief Risk Officer confirming the customer's ability of servicing
debt obligation upto a forseeable future.
Probability of default estimation process
The Bank estimates the probability of default (PD) based on historical information with regard to delinquency of loans and advances.
In this process historical information pertaining to 3-5 years have been used depending on the nature of the product.
Exposure at default
The exposure at default (EAD) represents the gross carrying amount of the financial instruments subject to the impairment calculation,
addressing both the client’s ability to increase its exposure while approaching default and potential early repayments too.
To calculate the EAD for a Stage 1 loan facilities, the Bank assesses the possible default events within 12 months in the calculation of
the 12mECL. For Stage 2, Stage 3 and Purchase or Credit impaired (POCI) financial assets, the exposure at default is considered for
events over the lifetime of the instruments.
The Bank determines EADs by modelling the range of possible exposure outcomes at various points in time. PDs are then assigned
to the EAD so derived.
Loss given default
The Bank segments its lending portfolio into homogeneous portfolios, based on key characteristics that are relevant to the estimation
of future cash flows. The loss given default is estimated based on historically collected loss data.
Significant increase in credit risk
The Bank continuously monitors all assets subject to ECLs. In order to determine whether an instrument or a portfolio of instruments
is subject to 12mECL or LTECL, the Bank assesses whether there has been a significant increase in credit risk since initial recognition.
The Bank considers an exposure to have significantly increased in credit risk when the borrower becomes 30 days past due from the
contractual due date.
The Bank also applies a secondary qualitative method for triggering a significant increase in credit risk for an asset, such as moving
a customer/facility to the watch list, or reschedulement or restructure. Regardless of the change in credit grades, if contractual
payments are more than 30 days past due, the credit risk is deemed to have increased significantly since initial recognition.
When estimating ECLs on a collective basis for a group of similar assets, the Bank applies the same principles for assessing whether
there has been a significant increase in credit risk since initial recognition.
Grouping financial assets measured on an individual basis/ collective basis
ECLs are calculated either on a collective or an individual basis, depends on the following factors.
The Bank calculates ECL on an individual basis for corporate and SME exposures above the threshold are identified as individually
significant loans. All other exposures other than the above together with individually significant exposures not attracting an ISL
provision are assessed for ECL on a collective basis. The Bank groups these exposures into smaller homogeneous portfolios, based
on product types, sectors and customer segments.

Further to the debt restructuring exercise currently being undertaken by the Government of Sri Lanka, certain guaranteed loans
granted by Bank of Ceylon to a State Owned Enterprise were transferred to the Government balance sheet under the Ministry of
Finance (MOF) pursuant to a cabinet decision effective from December 31, 2022 and currently the Bank is in discussion with the MOF
to agree on the indicative debt service terms in relation to such loans owed to the Bank. MOF has agreed to an interim debt service
rate until such time the indicative debt service terms in relation to these loans are finalised.
However, as the discussions between the Bank and the MOF are still on going as of the date of reporting, the impact of the said
restructure is yet to be finalised and the bank will account for the indicative debt service terms once the terms are agreed.
Based on the best available information as of the date of release of these financial statements the management is of the view that the
potential restructure based on the indicative terms is unlikely to have a material adverse impact on the Bank’s Income Statement or
net assets in line with SLFRS 9 - "Financial Instruments".
28.1 Financial assets at amortised cost - loans and advances
Bank
Group
As at 31 December
Note
2023
2022
2023
2022
LKR ‘000
LKR ‘000
LKR ‘000
LKR ‘000
Gross loans and advances
2,457,771,739
2,584,778,967
2,491,980,528
2,617,905,189
Stage 1
1,807,745,963
1,986,928,070
1,830,121,287
2,002,738,770
Stage 2
338,162,831
273,220,831
347,245,385
277,121,666
Stage 3
311,862,945
324,630,066
314,613,856
338,044,753
Less: accumulated provision for impairment under:
248,709,815
259,184,638
251,369,300
261,926,856
Stage 1
28.2
31,412,474
39,710,949
32,622,298
39,904,019
Stage 2
28.2
28,817,796
25,419,553
29,929,889
25,564,731
Stage 3
28.2
188,479,545
194,054,136
188,817,113
196,458,106
Net loans and advances
2,209,061,924
2,325,594,329
2,240,611,228
2,355,978,333
28.1.1 Analysis of gross loans and advances - by product
Bank
As at 31 December
2023
2022
Note
Local currency
loans
Foreign
currency loans
Total
Local
currency loans
Foreign
currency loans
Total
LKR '000
LKR '000
LKR '000
LKR '000
LKR '000
LKR '000
Term loans
712,215,257
704,469,083
1,416,684,340
746,658,700
788,273,917
1,534,932,617
Housing loans
71,231,393
32,858
71,264,251
78,125,880
46,205
78,172,085
Trade finance
51,417,495
70,443,434
121,860,929
39,846,557
73,328,306
113,174,863
Personal loans
360,375,320
-
360,375,320
413,928,850
-
413,928,850
Overdrafts
130,674,115
68,855,646
199,529,761
146,415,234
67,382,222
213,797,456
Credit cards
9,624,273
-
9,624,273
7,483,788
-
7,483,788
Lease rental receivables
28.4
15,995,619
-
15,995,619
20,673,590
-
20,673,590
Pawning
163,247,841
-
163,247,841
116,879,501
-
116,879,501
Foreclosed properties
3,891,415
8,149
3,899,564
3,325,096
8,624
3,333,720
Staff loans
23,342,463
218,051
23,560,514
26,186,008
32,490
26,218,498
Other
61,411,227
10,318,100
71,729,327
47,861,160
8,322,839
56,183,999
Gross loans and advances
1,603,426,418
854,345,321
2,457,771,739
1,647,384,364
937,394,603
2,584,778,967
NOTES TO THE FINANCIAL STATEMENTS
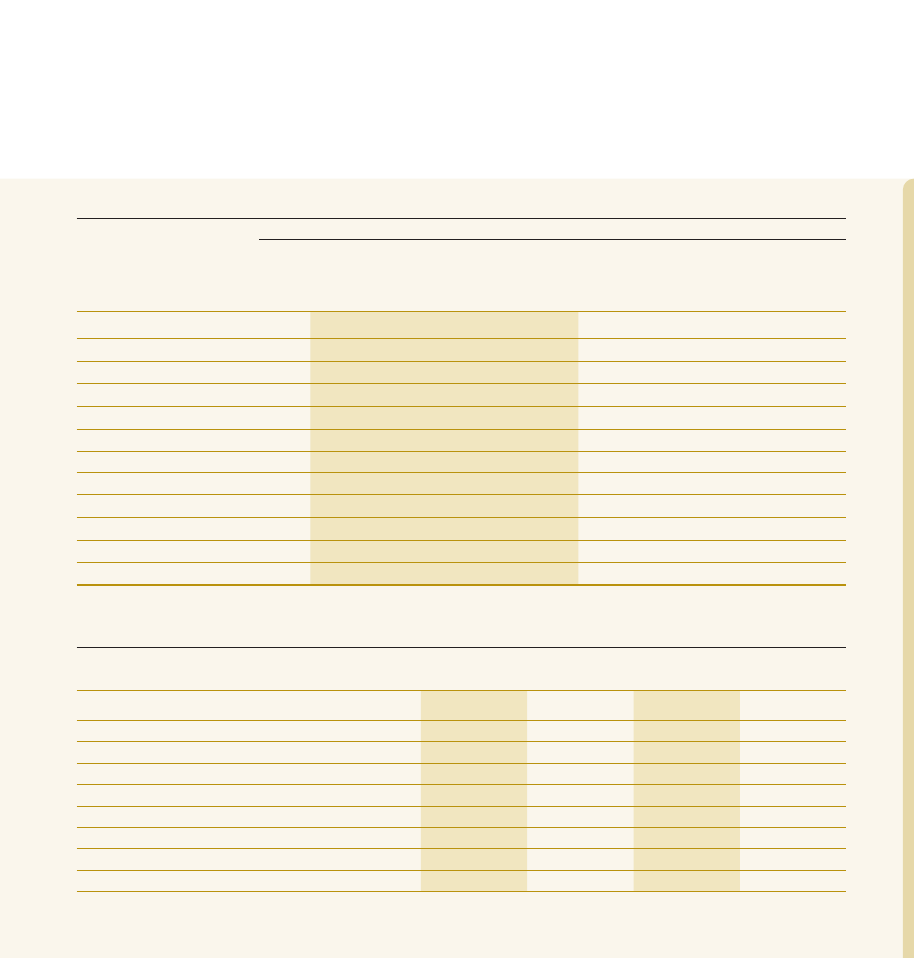
Group
As at 31 December
2023
2022
Note
Local
currency
loans
Foreign
currency
loans
Total
Local
currency
loans
Foreign
currency
loans
Total
LKR '000
LKR '000
LKR '000
LKR '000
LKR '000
LKR '000
Term loans
718,675,881
718,143,803
1,436,819,684
755,678,340
795,933,677
1,551,612,017
Housing loans
71,256,953
32,858
71,289,811
78,155,920
46,205
78,202,125
Trade finance
51,641,847
70,443,434
122,085,281
40,077,612
73,328,306
113,405,918
Personal loans
361,359,304
-
361,359,304
415,315,733
-
415,315,733
Overdrafts
130,597,463
69,150,463
199,747,926
146,223,589
67,622,802
213,846,391
Credit cards
9,624,273
-
9,624,273
7,483,788
-
7,483,788
Lease rental receivables
28.4
24,381,339
-
24,381,339
29,509,308
-
29,509,308
Pawning
167,225,944
-
167,225,944
122,545,263
-
122,545,263
Foreclosed properties
3,891,415
8,149
3,899,564
3,325,096
8,624
3,333,720
Staff loans
23,580,654
237,421
23,818,075
26,420,658
46,269
26,466,927
Other
61,411,227
10,318,100
71,729,327
47,861,160
8,322,839
56,183,999
Gross loans and advances
1,623,646,300
868,334,228
2,491,980,528
1,672,596,467
945,308,722
2,617,905,189
28.1.2 Analysis of gross loans and advances - by currency
Bank
Group
As at 31 December
2023
2022
2023
2022
LKR ‘000
LKR ‘000
LKR ‘000
LKR ‘000
Sri Lankan Rupees
1,603,426,418
1,647,384,364
1,623,646,300
1,672,596,467
United States Dollar
806,985,112
888,791,091
806,985,112
888,791,091
Great Britain Pound
1,076,789
1,110,713
15,065,696
9,024,833
Maldevian Rufiyaa
23,941,822
27,629,480
23,941,822
27,629,480
Euro
1,367,590
2,641,218
1,367,590
2,641,218
Indian Rupee
18,172,969
14,344,266
18,172,969
14,344,266
Seychellois Rupee
2,796,005
2,871,299
2,796,005
2,871,299
Other
5,034
6,536
5,034
6,535
Gross loans and advances
2,457,771,739
2,584,778,967
2,491,980,528
2,617,905,189

28.2 Movement in Provision for Impairment during the year
Bank
Group
2023
2022
2023
2022
LKR ‘000
LKR ‘000
LKR ‘000
LKR ‘000
Movement in Stage 1 impairment
Balance as at 1 January
39,710,949
24,417,936
39,904,019
24,541,662
Charge/ (reversal) during the year
(7,670,654)
15,135,491
(7,817,368)
15,204,835
Amount recovered / reversal during the year
-
-
-
-
Exchange rate variance on foreign currency impairment
(627,821)
347,791
(627,821)
347,791
Amount written-off during the year
-
-
-
-
Other movements
-
(190,269)
1,163,468
(190,269)
Balance as at 31 December
31,412,474
39,710,949
32,622,298
39,904,019
Bank
Group
2023
2022
2023
2022
LKR ‘000
LKR ‘000
LKR ‘000
LKR ‘000
Movement in Stage 2 impairment
Balance as at 1 January
25,419,553
15,122,165
25,564,731
15,247,177
Charge/ (reversal) during the year
6,263,585
10,344,926
6,257,962
10,365,092
Amount recovered / reversal during the year
-
-
-
-
Exchange rate variance on foreign currency impairment
(2,865,342)
687,473
(2,865,342)
687,473
Amount written-off during the year
-
-
-
-
Other movements
-
(735,011)
972,538
(735,011)
Balance as at 31 December
28,817,796
25,419,553
29,929,889
25,564,731
Bank
Group
2023
2022
2023
2022
LKR ‘000
LKR ‘000
LKR ‘000
LKR ‘000
Movement in Stage 3 impairment
Balance as at 1 January
194,054,136
123,365,781
196,458,106
126,448,164
Charge/ (reversal) during the year
16,465,658
49,602,382
16,460,896
49,496,367
Amount recovered/ reversal during the year
(17,722,433)
(4,322,117)
(17,722,433)
(4,322,117)
Exchange rate variance on foreign currency impairment
(4,317,816)
24,289,327
(4,317,816)
24,289,327
Amount written-off during the year
(86,065)
(18,554)
(86,065)
(18,554)
Other movements
86,065
1,137,317
(1,975,575)
564,919
Balance as at 31 December
188,479,545
194,054,136
188,817,113
196,458,106
NOTES TO THE FINANCIAL STATEMENTS
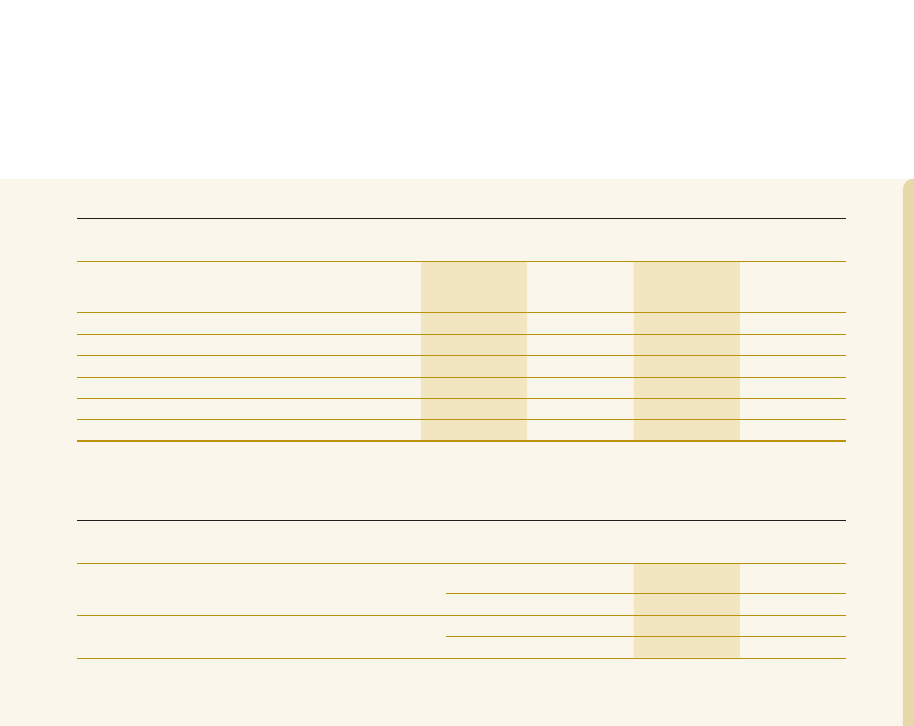
Bank
Group
2023
2022
2023
2022
LKR ‘000
LKR ‘000
LKR ‘000
LKR ‘000
Movement in total impairment
Balance as at 1 January
259,184,638
162,905,882
261,926,856
166,237,003
Charge/ (reversal) during the year
15,058,589
75,082,799
14,901,490
75,066,294
Amount recovered/ reversal during the year
(17,722,433)
(4,322,117)
(17,722,433)
(4,322,117)
Exchange rate variance on foreign currency impairment
(7,810,979)
25,324,591
(7,810,979)
25,324,591
Amount written-off during the year
(86,065)
(18,554)
(86,065)
(18,554)
Other movements
86,065
212,037
160,431
(360,361)
Balance as at 31 December
248,709,815
259,184,638
251,369,300
261,926,856
28.3 Sensitivity factors used to calculate impairement provision
Sensitivity effect on
impairment provisions
Sensitivity
2023
2022
LKR ‘000
LKR ‘000
Change in Loss Given Default (LGD)
1%
3,063,592
5,600,134
-1%
(3,063,592)
(5,600,134)
Change in Economic Factor Adjustment (EFA)
Worst case degrades by 5%
1,086,540
402,585
Worst case upgrades by 5%
(1,086,540)
(402,585)
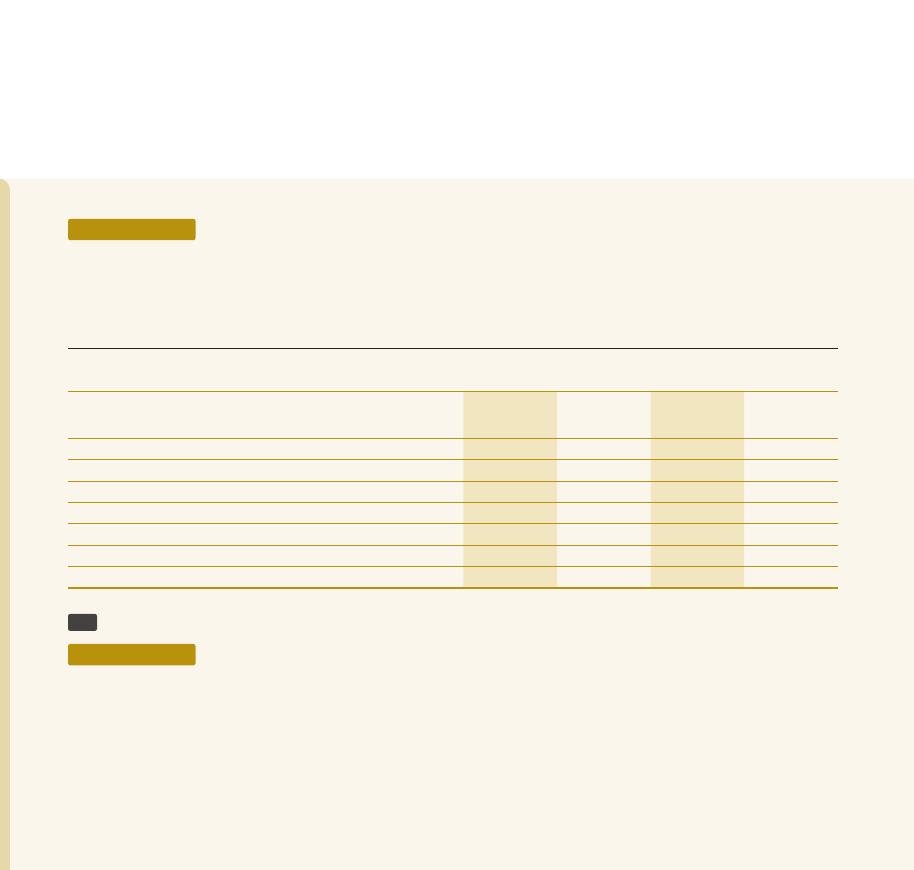
28.4 Lease rentals receivables
Accounting policy
Assets leased to customers, which transfer substantially all the risks and rewards associated with ownership, other than legal title,
are classified as finance leases. Amounts receivable under finance leases are classified as lease and hire purchase receivables and
presented within loans and receivables to customers in the Statement of Financial Position, after deduction of unearned lease income
and the impairment for rentals doubtful of recovery.
Bank
Group
As at 31 December
2023
2022
2023
2022
LKR ‘000
LKR ‘000
LKR ‘000
LKR ‘000
Gross lease rentals receivable
Within one year
9,662,055
12,339,150
10,042,150
15,170,120
One to five years
10,693,168
14,505,542
18,531,230
18,531,230
More than five years
83,228
53,441
333,621
333,620
20,438,451
26,898,133
28,907,001
34,034,970
Less : Unearned finance income
4,442,832
6,224,543
4,525,662
4,525,662
Gross lease rentals receivables
15,995,619
20,673,590
24,381,339
29,509,308
Less : Provision for impairment losses
1,021,043
777,902
2,145,118
1,901,977
Net lease rentals receivables
14,974,576
19,895,688
22,236,221
27,607,331
29
Financial assets at amortised cost - debt and other instruments
Accounting policy
Financial assets measured at amortised cost - debt instruments are initially measured at fair value and details are given in Note 4.4.8
to the financial statements. After initial measurement, subsequently measured at amortised cost using the Effective Interest Rate
(EIR) less impairment. Amortised cost is calculated by taking into account any discount or premium on acquisition and fees that are
an integral part of the EIR. The amortisation is included in ‘Interest income’ (Note 8.1) in the Statement of Profit or Loss. The losses
arising from impairment of such investments are recognised in the Statement of Profit or Loss under "Impairment charge / (reversal)
for loans and other losses" (Note 14).
NOTES TO THE FINANCIAL STATEMENTS
Bank
Group
As at 31 December
Note
2023
2022
2023
2022
LKR ‘000
LKR ‘000
LKR ‘000
LKR ‘000
Government securities
Treasury bills
312,941,117
30,163,644
314,299,888
34,264,372
Treasury bonds
1,260,787,465
1,236,801,214
1,264,752,387
1,238,665,103
Sri Lanka Soverign Bonds
29.4
87,344,675
92,256,000
87,669,056
92,609,945
Sri Lanka development bonds
29.5
-
193,631,101
-
193,631,101
Governement of Sri Lanka Restructuring Bonds
29.6
-
8,968,474
-
8,968,474
Debentures
29.7
2,132,036
3,427,632
2,159,648
3,427,632
Trust certificates
29.8
-
-
574,675
-
Government securities - In Maldives
38,752,030
44,463,297
38,752,030
44,463,297
Other investments
-
-
228,946
375,597
Gross financial assets at amortised cost - debt and other
instruments
1,701,957,323
1,609,711,362
1,708,436,630
1,616,405,521
Less-Accumulated impairment
29.3
48,228,920
53,814,055
48,423,652
54,031,842
Net financial assets at amortised cost - debt and other
instruments
1,653,728,403
1,555,897,307
1,660,012,978
1,562,373,679
29.1 Analysis of financial assets at amortised cost - debt and other instruments by currency
Bank
Group
As at 31 December
2023
2022
2023
2022
LKR ‘000
LKR ‘000
LKR ‘000
LKR ‘000
Sri Lankan Rupee
1,575,860,618
1,279,360,964
1,582,015,544
1,285,701,178
United States Dollar
87,344,675
285,887,101
87,669,056
286,241,046
Maldivian Rufiyaa
38,752,030
44,463,297
38,752,030
44,463,297
Total
1,701,957,323
1,609,711,362
1,708,436,630
1,616,405,521

29.2 Analysis of financial assets at amortised cost - debt and other instruments based on exposure to credit risk
Bank
As at 31 December
2023
2022
Stage 1
Stage 2
Stage 3
Total
Total
LKR ‘000
LKR ‘000
LKR ‘000
LKR ‘000
LKR ‘000
Sri Lanka Soverign Bonds
-
87,344,675
-
87,344,675
92,256,000
Sri Lanka Development Bonds
-
-
-
-
193,631,101
Debentures
2,103,722
-
28,314
2,132,036
3,427,632
Government securities - In Maldives
38,752,030
-
-
38,752,030
44,463,297
40,855,752
87,344,675
28,314
128,228,741
333,778,030
Less : Accumulated impairment
3,047
48,197,559
28,314
48,228,920
53,814,055
Total
40,852,705
39,147,116
-
79,999,821
279,963,975
Group
As at 31 December
2023
2022
Stage 1
Stage 2
Stage 3
Total
Total
LKR ‘000
LKR ‘000
LKR ‘000
LKR ‘000
LKR ‘000
Sri Lanka Soverign Bonds
-
87,669,056
-
87,669,056
92,609,945
Sri Lanka Development Bonds
-
-
-
-
193,631,101
Debentures
2,131,334
-
28,314
2,159,648
3,427,632
Trust certificates
574,675
-
-
574,675
-
Government securities - In Maldives
38,752,030
-
-
38,752,030
44,463,297
Other investments
228,946
-
-
228,946
375,597
41,686,985
87,669,056
28,314
129,384,355
334,507,572
Less : Accumulated impairment
220,834
48,174,504
28,314
48,423,652
54,031,842
Total
41,466,151
39,494,552
-
80,960,703
280,475,730
29.3 Movement in provision for impairment during the year
Bank
Group
2023
2022
2023
2022
LKR ‘000
LKR ‘000
LKR ‘000
LKR ‘000
Movement in Stage 1 impairment
Balance as at 1 January
323,914
13,770,767
541,701
13,829,176
Charge/(reversal) during the year
(320,867)
(13,446,853)
(320,867)
(13,287,475)
Exchange adjustment
-
-
-
-
Balance as at 31 December
3,047
323,914
220,834
541,701

Bank
Group
2023
2022
2023
2022
LKR ‘000
LKR ‘000
LKR ‘000
LKR ‘000
Movement in Stage 2 impairment
Balance as at 1 January
53,461,827
-
53,461,827
-
Charge/(reversal) during the year
(1,684,832)
29,510,499
(1,684,832)
29,510,499
Exchange adjustment
(3,579,436)
23,951,328
(3,602,491)
23,951,328
Balance as at 31 December
48,197,559
53,461,827
48,174,504
53,461,827
Bank
Group
2023
2022
2023
2022
LKR ‘000
LKR ‘000
LKR ‘000
LKR ‘000
Movement in Stage 3 impairment
Balance as at 1 January
28,314
28,314
28,314
28,314
Charge/(reversal) during the year
-
-
-
-
Exchange adjustment
-
-
-
-
Balance as at 31 December
28,314
28,314
28,314
28,314
Bank
Group
2023
2022
2023
2022
LKR ‘000
LKR ‘000
LKR ‘000
LKR ‘000
Movement in total impairment
Balance as at 1 January
53,814,055
13,799,081
54,031,842
13,857,490
Charge/(reversal) during the year
(2,005,699)
16,063,646
(2,005,699)
16,223,024
Exchange adjustment
(3,579,436)
23,951,328
(3,602,491)
23,951,328
Balance as at 31 December
48,228,920
53,814,055
48,423,652
54,031,842
Staging and allowances for ECL of ISB
International Sovereign Bonds issued by GOSL (SLISBs) are classified under stage 2 in line with Banking Act Direction No. 14 of
2021,- Classification, Recognition and Measurement of Financial Assets Other than Credit Facilities in Licensed Banks.The Bank
considered the latest available information including the indicative terms of the external restructuring exercise currently being
undertaken by the Government of Sri Lanka in estimating the impairment provision of SLISB’s as at 31 December 2023.
Day 1 loss on LKR bonds which replaced Sri Lanka Development Bonds
The Day 1 losses relating to LKR bonds which replaced Sri Lanka Development Bonds as a part of the Domestic Debt
Optimization exercise undertaken in July 2023 by the Government of Sri Lanka was estimated considering a comparable
instrument as at 31 December 2023.

29.4 Sri Lanka Sovereign Bonds (US Dollar bonds)
Bank
As at 31 December
2023
2022
Date of
Amount
Cost of
Amount
Cost of
maturity
invested
investment
invested
investment
USD '000
LKR '000
USD '000
LKR '000
Fixed Rate
Sri Lanka Sovereign Bonds - Fixed Rate 5.875%
N/A*
26,856
8,699,284
26,856
9,751,854
Sri Lanka Sovereign Bonds - Fixed Rate 5.75%
N/A**
20,519
6,646,582
20,519
7,450,631
Sri Lanka Sovereign Bonds -
14.03.2024
11,656
3,775,650
11,656
4,232,374
Sri Lanka Sovereign Bonds - Fixed Rate 6.35%
28.06.2024
2,014
652,382
2,014
731,412
Sri Lanka Sovereign Bonds -
03.11.2025
49,101
15,904,958
49,101
17,829,182
Sri Lanka Sovereign Bonds - Fixed Rate 6.825%
18.07.2026
22,600
7,320,667
22,600
8,206,193
Sri Lanka Sovereign Bonds - Fixed Rate 6.20%
11.05.2027
23,565
7,633,253
23,565
8,556,675
Sri Lanka Sovereign Bonds - Fixed Rate 6.75%
18.04.2028
33,077
10,714,411
33,077
12,010,705
Sri Lanka Sovereign Bonds - Fixed Rate 7.85%
14.03.2029
32,352
10,479,567
32,352
11,747,322
Sri Lanka Sovereign Bonds - Fixed Rate 7.55%
28.03.2030
4,168
1,350,112
4,168
1,513,584
Total Sri Lanka Sovereign Bonds
225,908
73,176,866
225,908
82,029,932
Amortization adjustment on interest
43,738
14,167,809
28,162
10,226,068
Total Sri Lanka Sovereign Bonds
269,646
87,344,675
254,070
92,256,000
* Original maturity was on 25 July 2022, but yet to be settled
** Original maturity was on 18 April 2023, but yet to be settled
Note : 2023 USD/LKR 323.9233 and 2022 USD/LKR 363.1100
29.5 Sri Lanka Development Bonds (US Dollar bonds)
Bank/ Group
As at 31 December
2023
2022
Date of
maturity
Amount
invested
Cost of
investment
Amortised
cost
Amount
invested
Cost of
investment
Amortised
cost
USD ‘000
LKR ‘000
LKR ‘000
USD ‘000
LKR ‘000
LKR ‘000
Fixed Rate
Sri Lanka Development Bonds - Fixed Rate 5.75% 01.05.2023
-
-
-
5,000
1,815,550
1,832,881
Sri Lanka Development Bonds - Fixed Rate 7.75% 01.05.2023
-
-
-
150,000
54,466,500
55,165,043
Sri Lanka Development Bonds - Fixed Rate 7.95% 01.05.2024
-
-
-
200,000
72,622,000
73,577,120
Floating Rate
6 months LIBOR plus 370 basis points
22.01.2023
-
-
-
5,000
1,815,550
1,873,026
6 months LIBOR plus 375 basis points
22.01.2023
-
-
-
5,000
1,815,550
1,872,621
6 months LIBOR plus 390 basis points
16.03.2023
-
-
-
5,000
1,815,550
1,857,695
6 months LIBOR plus 395 basis points
16.03.2023
-
-
-
5,000
1,815,550
1,857,432
Total Sri Lanka Development Bonds
-
-
-
375,000
136,166,250
138,035,818
Already matured but not settled as at 31/12/2022
-
-
-
130,000
47,204,300
55,595,283
Total Sri Lanka Development Bonds
-
-
-
505,000
183,370,550
193,631,101
Group
2023
2022
Amount
Cost of
Amount
Cost of
invested
investment
invested
investment
USD '000
LKR '000
USD '000
LKR '000
26,856
8,699,284
26,856
9,751,854
21,494
6,962,407
21,494
7,804,578
11,656
3,775,650
11,656
4,232,374
2,014
652,382
2,014
731,412
49,101
15,904,958
49,101
17,829,182
22,600
7,320,667
22,600
8,206,193
23,565
7,633,253
23,565
8,556,675
33,077
10,714,411
33,077
12,010,705
32,352
10,479,567
32,352
11,747,322
4,168
1,350,112
4,168
1,513,584
226,883
73,492,691
226,883
82,383,879
43,764
14,176,365
28,162
10,226,066
270,647
87,669,056
255,045
92,609,945

29.6 Government of Sri Lanka Restructuring Bonds
Bank/ Group
As at 31 December
2023
2022
Rate
Date of
issue
Date of
maturity
Cost of
investment
Amortised
cost
Cost of
investment
Amortised
cost
%
LKR ‘000
LKR ‘000
LKR ‘000
LKR ‘000
For recapitalisation purposes
12.0
24.03.1993
01.02.2023
-
-
4,780,000
5,015,714
For settlement of loans
12.0
24.03.1993
01.02.2023
-
-
3,767,000
3,952,760
Total Government of Sri Lanka
Restructuring Bonds
-
-
8,547,000
8,968,474
29.7 Debentures
Bank
As at 31 December
2023
2022
Date of
maturity
Coupon
rate %
Number of
debentures
Cost of
investment
Amortised
cost
Number of
debentures
Cost of
investment
Amortised
cost
LKR '000
LKR '000
LKR '000
LKR '000
Browns Investments PLC
31.03.2027
15.42
500,000
50,000
51,951
500,000
50,000
51,946
Ceylon Electricity Board
15.04.2026
9.35
4,601,000
460,100
490,279
4,601,000
460,100
490,793
Citizen Development Business
Finance PLC
27.03.2023
14.20
-
-
-
2,000,000
200,000
221,212
Commercial Credit and Finance PLC
04.03.2026
9.00
1,000,000
100,000
107,389
1,000,000
100,000
107,389
DFCC Bank PLC
29.03.2025
13.00
2,250,000
225,000
246,619
2,250,000
225,000
246,797
Hatton National Bank PLC
01.11.2023
13.00
-
-
-
193,300
19,330
19,722
Hayleys PLC
31.07.2023
12.50
-
-
-
2,500,000
250,000
263,128
Hayleys PLC
26.08.2024
7.82
1,000,000
100,000
106,041
1,000,000
100,000
103,625
Hayleys PLC
26.08.2024
13.00
1,811,500
181,150
189,303
1,811,500
181,150
190,575
Kotagala Plantations PLC
31.08.2025
7.50
N/A
6,086
5,613
N/A
9,129
9,050
Kotagala Plantations PLC
31.08.2025
7.50
N/A
6,639
6,825
N/A
9,959
10,252
Lanka Orix Leasing Company PLC
27.09.2024
15.00
1,250,000
125,000
130,189
1,250,000
125,000
130,657
Lanka Orix Leasing Company PLC
24.02.2026
10.25
1,300,000
130,000
137,444
1,300,000
130,000
139,972
MTD Walkers PLC
N/A
11.75
254,784
25,478
28,314
254,784
25,478
28,314
People's Leasing and Finance PLC
18.04.2023
12.80
-
-
-
2,500,000
250,000
272,125
People's Leasing and Finance PLC
05.08.2026
9.00
999,915
99,992
119,559
999,915
99,992
112,615
Sampath Bank PLC
20.03.2023
12.50
-
-
-
2,500,000
250,000
258,703
Seylan Bank PLC
29.03.2023
12.85
-
-
-
2,500,000
250,000
258,244
Sri Lanka Telecom PLC
19.04.2028
12.75
5,000,000
500,000
512,510
5,000,000
500,000
512,513
Total debentures
2,009,445
2,132,036
3,235,138
3,427,632
NOTES TO THE FINANCIAL STATEMENTS

Group
As at 31 December
2023
2022
Date of
maturity
Coupon
rate %
Number of
debentures
Cost of
investment
Amortised
cost
Number of
debentures
Cost of
investment
Amortised
cost
LKR '000
LKR '000
LKR '000
LKR '000
Browns Investments PLC
31.03.2027
15.42
500,000
50,000
51,951
500,000
50,000
51,946
Ceylon Electricity Board
15.04.2026
9.35
4,601,000
460,100
490,279
4,601,000
460,100
490,793
Citizen Development Business
Finance PLC
27.03.2023
14.20
-
-
-
2,000,000
200,000
221,212
Commercial Credit and Finance PLC
04.03.2026
9.00
1,000,000
100,000
107,389
1,000,000
100,000
107,389
DFCC Bank PLC
29.03.2025
13.00
2,250,000
225,000
246,619
2,250,000
225,000
246,797
Hatton National Bank PLC
01.11.2023
13.00
-
-
-
193,300
19,330
19,722
Hayleys PLC
31.07.2023
12.50
-
-
-
2,500,000
250,000
263,128
Hayleys PLC
26.08.2024
7.82
1,000,000
100,000
106,041
1,000,000
100,000
103,625
Hayleys PLC
26.08.2024
13.00
1,811,500
181,150
189,303
1,811,500
181,150
190,575
Kotagala Plantations PLC
31.08.2025
7.50
N/A
6,086
5,613
N/A
9,129
9,050
Kotagala Plantations PLC
31.08.2025
7.50
N/A
6,639
6,825
N/A
9,959
10,252
Lanka Orix Leasing Company PLC
27.09.2024
15.00
1,250,000
125,000
130,189
1,250,000
125,000
130,657
Lanka Orix Leasing Company PLC
24.02.2026
10.25
1,300,000
130,000
137,444
1,300,000
130,000
139,972
MTD Walkers PLC
N/A
11.75
254,784
25,478
28,314
254,784
25,478
28,314
People's Leasing and Finance PLC
18.04.2023
12.80
-
-
-
2,500,000
250,000
272,125
People's Leasing and Finance PLC
05.08.2026
9.00
999,915
99,992
119,559
999,915
99,992
112,615
Sampath Bank PLC
20.03.2023
12.50
-
-
-
2,500,000
250,000
258,703
Seylan Bank PLC
29.03.2023
12.85
-
-
-
2,500,000
250,000
258,244
Seylan Bank PLC
02.05.2023
25.00
263,800
26,380
27,612
-
-
-
Sri Lanka Telecom PLC
19.04.2028
12.75
5,000,000
500,000
512,510
5,000,000
500,000
512,513
Total debentures
2,035,825
2,159,648
3,235,138
3,427,632
29.8 Trust Certificates
Group
As at 31 December
2023
2022
Cost of investment Amortised cost Cost of investment
Amortised cost
LKR ‘000
LKR ‘000
LKR ‘000
LKR ‘000
Commercial Credit & Finance PLC
150,000
167,663
-
-
LOLC Finance PLC
350,000
407,012
-
-
Total trust certificates
500,000
574,675
-
-
30
Financial assets measured at fair value through OCI
Accounting policy
Financial assets measured at fair value through OCI include equity instruments which are elected fair value through OCI option at the
initial recognition and debt instruments which contractual terms that give rise to cash flows on specified dates, that represent solely
payments of principal and interest on the principal amount outstanding; and are held within a business model whose objective is
achieved by both collecting contractual cash flows and selling financial assets.
All Financial assets measured at fair value through OCI are initially and subsequently measured at fair value. Unrealised gains and
losses are recognised directly in equity in the ‘OCI reserve’ through Other Comprehensive Income. When the debt instrument under
FVTOCI is disposed off, the cumulative gain or loss previously recognised in OCI reserve is recognised in the Statement of Profit
or Loss and reflected in "Net gains/ (losses) from derecognition of financial assets" (Note12). When the equity instrument under
FVTOCI is disposed off, the cumulative gain or loss previously recognised in OCI reserve is not recognised in the Statement of Profit
or Loss and transfer directly to the retained profit. Interest earned whilst holding financial assets measured at fair value through OCI
is reported as "Interest income" (Note 8.1) . Dividends earned whilst holding financial assets measured at fair value through OCI are
recognised in the Statement of Profit or Loss under in "Net Other Operating Income" (Note 13) when the right of the payment has
been established.
Bank
Group
As at 31 December
Note
2023
2022
2023
2022
LKR ‘000
LKR ‘000
LKR ‘000
LKR ‘000
Government Securities in Sri Lanka
Treasury bills
27,551,288
-
27,551,288
-
Treasury bonds
12,020,034
326,563
12,106,493
326,563
Government Securities in India
2,866,609
3,034,704
2,866,609
3,034,704
Quoted equities
30.2
2,949,810
1,543,243
5,528,440
3,601,623
Unquoted Equities
30.3
4,146,257
3,786,292
4,146,855
3,787,154
Total financial assets measured at FVTOCI
49,533,998
8,690,802
52,199,685
10,750,044
30.1 By Currency
Bank
Group
As at 31 December
2023
2022
2023
2022
LKR ‘000
LKR ‘000
LKR ‘000
LKR ‘000
Sri Lankan Rupee
42,756,145
2,104,819
45,421,832
4,164,061
United States Dollar
3,851,891
3,487,263
3,851,891
3,487,263
Euro
59,353
64,016
59,353
64,016
Indian Rupee
2,866,609
3,034,704
2,866,609
3,034,704
Total
49,533,998
8,690,802
52,199,685
10,750,044

30.2 Quoted equities
As at 31 December
2023
2022
Number of
ordinary shares
Cost of
investment
Market
value
Number of
ordinary shares
Cost of
investment
Market
value
LKR '000
LKR '000
LKR '000
LKR '000
Bank
National Development Bank PLC
31,749,539
1,928,451
2,063,720
30,210,035
1,859,497
966,721
People's Leasing & Finance PLC
14,803,129
240,815
158,393
14,803,129
240,815
74,016
Seylan Bank PLC
16,690,292
654,921
727,697
15,902,140
627,887
502,506
Total quoted equities
2,824,187
2,949,810
2,728,199
1,543,243
Group
Asiri Hospitals Holdings PLC
30
30
1
30
30
1
Ceylinco Insurance PLC
26
26
64
26
26
58
Hatton National Bank PLC
18
18
3
18
18
2
LVL Energy Fund PLC
2,500,000
20,000
13,750
2,500,000
20,000
20,000
National Development Bank PLC
31,749,539
1,928,451
2,063,720
30,210,035
1,859,497
966,721
People's Leasing and Finance PLC
14,803,129
240,815
158,393
14,803,129
240,815
74,016
Seylan Bank PLC
16,690,292
654,921
727,697
15,902,140
627,887
502,506
Lanka Hospital Corporation PLC
21,329,000
213,290
2,564,812
21,329,000
213,290
2,038,319
Total quoted equities
3,057,551
5,528,440
2,961,563
3,601,623

30.3 Unquoted equities
As at 31 December
2023
2022
Note
Number of
ordinary shares
Cost of
investment
Market
value
Number of
ordinary shares
Cost of
investment
Market
value
LKR '000
LKR '000
LKR '000
LKR '000
Bank
Credit Information Bureau of Sri Lanka
46,600
43,645
43,645
46,600
43,645
43,645
Fitch Ratings Lanka Limited
62,500
625
625
62,500
625
625
LankaClear (Private) Limited
2,113,861
23,443
23,443
2,113,861
23,443
23,443
Lanka Financial Services Bureau Limited
500,000
5,000
5,000
500,000
5,000
5,000
MasterCard Incorporated
17,200
-
2,378,799
17,200
-
2,171,745
Regional Development Bank
16,448,448
162,300
162,300
16,448,448
162,300
162,300
Visa Inc.
17,438
-
1,473,092
17,438
-
1,315,518
SWIFT
29
64,016
59,353
29
64,016
64,016
299,029
4,146,257
299,029
3,786,292
Fair value adjustment
3,847,228
3,487,263
Less - Provision for impairment
30.4
-
-
Total unquoted equities
4,146,257
4,146,257
3,786,292
3,786,292
Group
Ceylinco Investment Company Limited
500,000
5,000
-
500,000
5,000
-
Credit Information Bureau of Sri Lanka
47,140
43,699
43,699
47,140
43,699
43,699
Fitch Ratings Lanka Limited
62,500
625
625
62,500
625
625
LankaClear (Private) Limited
2,113,861
23,443
23,443
2,113,861
23,443
23,443
Lanka Financial Services Bureau Limited
500,000
5,000
5,000
500,000
5,000
5,000
MasterCard Incorporated
17,200
-
2,378,799
17,200
-
2,171,745
Mega Containers Limited
1,000,000
10,000
-
1,000,000
10,000
-
Regional Development Bank
16,448,448
162,300
162,300
16,448,448
162,300
162,300
Ranwan Industries (Private) Limited
165,900
3,600
-
165,790
3,600
-
UB Finance Company Limited
2,506,562
17,546
544
2,506,562
17,546
808
Visa Inc.
17,438
-
1,473,092
17,438
-
1,315,518
SWIFT
29
64,016
59,353
29
64,016
64,016
335,229
4,146,855
335,229
3,787,154
Fair value adjustment
3,847,228
3,472,817
Less - Provision for impairment
30.4
35,602
20,892
Total unquoted equities
4,146,855
4,146,855
3,787,154
3,787,154
NOTES TO THE FINANCIAL STATEMENTS
30.4 Movement in provision for impairment during the year
Bank
Group
2023
2022
2023
2022
LKR ‘000
LKR ‘000
LKR ‘000
LKR ‘000
Movement in Stage 1 Impairment
Balance as at 1 January
-
-
20,892
21,392
Charge/(reversal) during the year
-
-
14,710
-
Write-off during the year
-
-
-
(500)
Balance as at 31 December
-
-
35,602
20,892
Bank
Group
2023
2022
2023
2022
LKR ‘000
LKR ‘000
LKR ‘000
LKR ‘000
Movement in total impairment
Balance as at 1 January
-
-
20,892
21,392
Charge/(reversal) during the year
-
-
14,710
-
Write-off during the year
-
-
-
(500)
Balance as at 31 December
-
-
35,602
20,892
31
Investment in subsidiary companies
Accounting policy
Subsidiaries are entities that are controlled by the Bank. Control is achieved when the Bank is exposed, or has rights, to variable
returns from its involvement with the investee and has the ability to affect the returns of those investees through its power over the
investee. Specifically, the Bank controls an investee if, and only if, the Bank has:
• power over the investee
• exposure or rights to variable returns from its involvement with the investee
• the ability to use its power over the investee to affect its returns
The Financial Statements of subsidiaries are included in the Consolidated Financial Statements from the date that control commences
until the date that control ceases. The Bank reassesses whether it has control if there are changes to one or more of the elements of
control. A change in the ownership interest of a subsidiary, without loss of control, is accounted for as an equity transaction. If the
Group loses control over a subsidiary, it derecognises the related assets (including goodwill), liabilities, non-controlling interest (NCI)
and other components of equity, while any resultant gain or loss is recognised in profit or loss. Any investment retained is recognised
at fair value at the date of loss of control.
The Consolidated Financial Statements are prepared for the common financial year end of 31 December and have been prepared
using uniform accounting policies for like transactions and other events in similar circumstances.
All intra group balances, income and expenses (except for foreign currency translation gains or losses) arising from intra group
transactions are eliminated on consolidation. Unrealised gains and losses resulting from transactions between the Group and
its associates are also eliminated on consolidation to the extent of the Group’s interests in the associates. Unrealised losses are
eliminated in the same way as unrealised gains, but only to the extent that there is no evidence of impairment.

There are no significant restrictions on the ability of subsidiaries to transfer funds to the parent in the form of cash dividends or to
repay loans and advances. All subsidiaries of the Bank have been incorporated in Sri Lanka except for Bank of Ceylon (UK) Limited,
which is incorporated in the United Kingdom. A list of the Bank’s subsidiaries is given in Note 31.5 to the Financial Statements.
As at 31 December
Note
2023
2022
LKR ‘000
LKR ‘000
Investment in quoted subsidiaries
31.3
3,922,772
3,922,772
Investment in unquoted subsidiaries
31.4
4,658,366
4,658,366
Total investment in subsidiaries
8,581,138
8,581,138
Less : Provision for impairment of investment in subsidiaries
31.2
400,000
400,000
Carrying value of investment in subsidiary companies
8,181,138
8,181,138
31.1 Movement in investment in subsidiary companies
As at 31 December
2023
2022
LKR ‘000
LKR ‘000
Balance as at 1 January
8,581,138
8,581,138
Increase/ (decrease) in investments
-
-
Balance as at 31 December
8,581,138
8,581,138
31.2 Provision for impairment of investment in subsidiaries*
As at 31 December
2023
2022
LKR ‘000
LKR ‘000
Balance as at 1 January
400,000
400,000
Impairment charge/ (reversal) during the year
-
-
Balance as at 31 December
400,000
400,000
* The Bank has made the provision of impairment for investment of Bank of Ceylon (UK) Limited.
31.3 Investment in quoted subsidiaries
Bank
As at 31 December
2023
2022
Cost
Market value
Cost
Market value
LKR ‘000
LKR ‘000
LKR ‘000
LKR ‘000
Merchant Bank of Sri Lanka and Finance PLC
3,922,772
1,766,940
3,922,772
1,365,363
(401,577,368 Ordinary shares )
Total investment in quoted subsidiaries
3,922,772
1,766,940
3,922,772
1,365,363
31.4 Investment in unquoted subsidiaries
Bank
As at 31 December
2023
2022
Cost
Directors'
valuation
Cost
Directors'
valuation
LKR ‘000
LKR ‘000
LKR ‘000
LKR ‘000
BOC Management and Support Services (Private) Limited
(99,996 Ordinary shares)
1,000
1,000
1,000
1,000
BOC Property Development and Management (Private) Limited
(100,999,998 Ordinary shares)
1,010,000
1,010,000
1,010,000
1,010,000
BOC Travels (Private) Limited (250,004 Ordinary shares )
2,500
2,500
2,500
2,500
Bank of Ceylon (UK) Limited (15,000,000 Ordinary shares)
2,683,859
2,283,859
2,683,859
2,283,859
Hotels Colombo (1963) Limited (10,073,667 Ordinary shares)
100,737
100,737
100,737
100,737
Property Development Limited (63,064,957 Ordinary shares)
860,270
860,270
860,270
860,270
Total investment in unquoted subsidiaries
4,658,366
4,258,366
4,658,366
4,258,366
31.5 Information relating to subsidiaries of the bank
Ownership interest held
by the Bank
(Including indirect intrest)
As at 31 December
2023
2022
%
%
Quoted subsidiaries
Merchant Bank of Sri Lanka and Finance PLC (MBSL)
84.50
84.50
Unquoted subsidiaries
BOC Management and Support Services (Private) Limited (MSS)
100.00
100.00
BOC Property Development and Management (Private) Limited (PDML)
100.00
100.00
BOC Travels (Private) Limited (TRAVELS)
100.00
100.00
Hotels Colombo (1963) Limited (HCL)
99.99
99.99
Ceybank Holiday Homes (Private) Limited (HH)
100.00
100.00
MBSL Insurance Company Limited (MBSL INS)
45.47
45.47
Bank of Ceylon (UK) Limited (BOC UK)
100.00
100.00
Property Development PLC (PDL)
97.89
97.89
Ceybank Holiday Homes (Private) Limited and MBSL Insurance Company Limited are indirect subsidiaries of the Bank.
BOC Management and Support Services (Private) Limited (MSS) is not in operation.

31.6 Non-controlling interest (NCI) of subsidiaries
2023
PDL
MBSL
MBSL INS
HCL
Equity interest held by the NCI (%)
2.11
23.44
46.19
0.01
Profit/ (loss) allocated during the year (LKR '000)
19,282
3,317
13,966
(30)
Accumulated balance of NCI as at 31 December (LKR '000)
146,619
860,526
454,977
(29)
Dividends paid to NCI (LKR '000)
11,468
-
-
-
2022
PDL
MBSL
MBSL INS
HCL
Equity interest held by the NCI (%)
2.11
23.44
46.19
0.01
Profit/ (loss) allocated during the year (LKR '000)
16,739
(92,418)
13,093
(8)
Accumulated balance of NCI as at 31 December (LKR '000)
121,654
835,058
436,750
(20)
Dividends paid to NCI (LKR '000)
-
-
-
-
31.7 Summarised financial information of subsidiaries
For the year ended 31 December
2023
PDL
MBSL
MSS
PDML
TRAVELS
LKR ‘000
LKR ‘000
LKR ‘000
LKR ‘000
LKR ‘000
Statement of profit or loss for the year
Total income
1,877,158
7,478,050
-
649,878
257,420
Profit/ (loss) before tax
1,292,120
68,395
-
453,794
126,107
Profit/ (loss) after tax
913,854
21,403
-
309,255
126,107
Other comprehensive income
520,607
(45,760)
-
32,065
(2,314)
Total comprehensive income
1,434,461
(24,357)
-
341,320
123,793
Statement of financial position as at 31 December
Total assets
7,777,012
33,659,529
819
2,350,448
457,723
Total liabilities
828,248
30,028,343
43
134,046
130,051
Net assets
6,948,764
3,631,186
776
2,216,402
327,672
Dividends paid
257,707
-
-
139,380
6,500
Statement of cash flows for the year
Operating cash flows
12,358
6,383,468
(36)
47,527
58,705
Investing cash flows
158,268
(6,717,620)
-
104,463
180,991
Financing cash flows
(255,702)
421,018
-
(139,306)
(8,983)
Net increase/ (decrease) in cash and cash equivalents
(85,076)
86,866
(36)
12,684
230,713
NOTES TO THE FINANCIAL STATEMENTS

For the year ended 31 December
2022
PDL
MBSL
MSS
PDML
TRAVELS
LKR ‘000
LKR ‘000
LKR ‘000
LKR ‘000
LKR ‘000
Statement of profit or loss for the year
Total income
1,551,547
6,542,591
-
546,701
108,870
Profit/ (loss) before tax
1,104,620
(658,149)
-
403,931
52,365
Profit/ (loss) after tax
793,328
(596,244)
-
278,910
52,365
Other comprehensive income
872,970
(10,179)
-
(101,895)
-
Total comprehensive income
1,666,298
(606,423)
-
177,015
52,365
Statement of financial position as at 31 December
Total assets
6,638,715
31,253,210
1,470
2,169,300
353,795
Total liabilities
873,145
27,690,678
470
154,837
137,293
Net assets
5,765,570
3,562,532
1,000
2,014,463
216,502
Dividends paid
-
-
-
93,930
-
Statement of cash flows for the year
Operating cash flows
362,702
5,102,515
-
148,742
32,094
Investing cash flows
(1,508,845)
(2,174,036)
-
1,387
12,285
Financing cash flows
(288,025)
(2,747,972)
-
(114,456)
(23,402)
Net increase/ (decrease) in cash and cash equivalents
(1,434,168)
180,507
-
35,673
20,977
For the year ended 31 December
2023
HCL
HH
MBSL INS
BoC UK
LKR ‘000
LKR ‘000
LKR ‘000
LKR ‘000
Statement of profit or loss for the year
Total income
271,397
177,976
977,383
3,031,190
Profit/ (loss) before tax
(295,358)
3,849
25,278
441,240
Profit/ (loss) after tax
(295,358)
3,849
25,611
378,310
Other comprehensive income
-
-
4,136
(308,638)
Total comprehensive income
(295,358)
3,849
29,747
69,672
Statement of financial position as at 31 December
Total assets
596,052
22,219
2,593,473
63,629,159
Total liabilities
888,466
85,947
1,608,461
57,543,838
Net assets
(292,414)
(63,728)
985,012
6,085,321
Dividends paid
-
-
-
-
Statement of cash flows for the year
Operating cash flows
201,500
10,920
181,274
1,530,967
Investing cash flows
(129,486)
24,381
(110,301)
(47,402)
Financing cash flows
7,895
(26,484)
(55,429)
-
Net increase/ (decrease) in cash and cash equivalents
79,909
8,817
15,544
1,483,565

For the year ended 31 December
2022
HCL
HH
MBSL INS
BoC UK
LKR ‘000
LKR ‘000
LKR ‘000
LKR ‘000
Statement of profit or loss for the year
Total income
106,659
135,284
810,894
1,362,433
Profit/ (loss) before tax
(76,832)
194
24,010
(54,096)
Profit/ (loss) after tax
(76,832)
194
24,010
(54,096)
Other comprehensive income
-
-
2,281
2,279,165
Total comprehensive income
(76,832)
194
26,291
2,225,069
Statement of financial position as at 31 December
Total assets
543,961
47,751
2,565,042
48,810,630
Total liabilities
748,676
112,642
1,619,490
42,794,981
Net assets
(204,715)
(64,891)
945,552
6,015,649
Dividends paid
-
-
-
-
Statement of cash flows for the year
Operating cash flows
(17,234)
(1,094)
165,912
122,457
Investing cash flows
(6,962)
685
1,359
(875)
Financing cash flows
(1,300)
(3,859)
(116,495)
-
Net increase/ (decrease) in cash and cash equivalents
(25,496)
(4,268)
50,776
121,582
32
Investment in associate companies
Accounting policy
Associates are those entities in which the Bank has significant influence, but not control, over the financial and operating policies.
Investments in associate entities are accounted for using the equity method (equity-accounted investees) and are recognised initially
at cost. The cost of the investment includes transaction costs.
The Consolidated Financial Statements include the Bank’s share of the profit or loss and other comprehensive income, after
adjustments to align the accounting policies with those of the Group, from the date that significant influence commences until the
date that significant influence ceases.
When the Bank’s share of losses exceeds its interest in an equity accounted investee, the carrying amount of that interest, including
any long term investments, is reported at nil and the recognition of further losses is discontinued except to the extent that the Group
has an obligation or has made payments on behalf of the investee. If the associate subsequently reports profits, the Bank resumes
recognising its share of those profits only after its share of the profits equals the share of losses not recognised.
A list of the Bank’s associates is shown in Note 32.4 to the Financial Statements.
The Bank discontinues the use of the Equity Method from the date that it ceases to have significant influence over an associate and
accounts for such investments in accordance with the Sri Lanka Accounting Standard – SLFRS 9 - "Financial Instruments"
Upon loss of significant influence over the associate, the Bank measures and recognises any retained investment at its fair value.
Any difference between the carrying amount of the associate upon loss of significant influence and the fair value of the retained
investment and proceeds from disposal is recognised in profit or loss.
NOTES TO THE FINANCIAL STATEMENTS

32.1 Unquoted associates
Bank
Group
As at 31 December
2023
2022
2023
2022
Note
Cost Directors'
Cost Directors'
Cost Directors'
Cost Directors'
valuation
valuation
valuation
valuation
LKR '000
LKR '000
LKR '000
LKR '000
LKR '000
LKR '000
LKR '000
LKR '000
Ceybank Asset Management Limited
(1,240,002 ordinary shares)
31,048
31,048
31,048
31,048
335,162
335,162
312,274
312,274
Lanka Securities (Private) Limited
(3,594,857 Ordinary shares)
41,940
41,940
41,940
41,940
247,544
247,544
209,603
209,603
Southern Development Financial Company
Limited (2,500,001 ordinary shares)
25,000
-
25,000
-
-
-
-
-
Transnational Lanka Records Solutions
(Private) Limited (2,000,000 ordinary shares)
20,000
20,000
20,000
20,000
154,409
154,409
162,659
162,659
Total investment in unquoted associates
117,988
92,988
117,988
92,988
737,115
737,115
684,536
684,536
Less - Provision for impairment of
investments in associates
32.3
25,000
-
25,000
-
-
-
-
-
Net investment in unquoted associates
92,988
92,988
92,988
92,988
737,115
737,115
684,536
684,536
32.2 Movement in investment in associate companies
Bank
Group
Cost
Equity Value
2023
2022
2023
2022
LKR ‘000
LKR ‘000
LKR ‘000
LKR ‘000
Balance as at 1 January
117,988
117,988
684,536
595,531
Share of profit/ (loss), net of tax
-
-
33,507
122,847
Share of other comprehensive income, net of tax
-
-
(2,109)
(20,342)
Share of dividends
-
-
(29,286)
(13,500)
Other adjustments
-
-
50,467
-
Balance as at 31 December
117,988
117,988
737,115
684,536
32.3 Movement in provision for impairment of investment in associate companies
Bank
2023
2022
LKR ‘000
LKR ‘000
Balance as at 1 January
25,000
25,000
Impairment charge/ (reversal) during the year
-
-
Balance as at 31 December
25,000
25,000

32.4 Share holding structure of associate companies
Equity interest %
Shareholding structure
Name of the company
2023
2022 Name
Holding %
Ceybank Asset Management Limited (CAML)
43.36
43.36 Bank of Ceylon
43.36
Sri Lanka Insurance Corporation
26.57
Unit Trust of India
17.48
Carson Cumberbatch PLC
12.59
Lanka Securities (Private) Limited (LSL)
44.51
44.51 First Capital Securities Corporation Limited
51.00
Merchant Bank of Sri Lanka and Finance
PLC
29.00
Bank of Ceylon
20.00
(Bank of Ceylon indirectly hold 24.51%)
Transnational Lanka Records Solutions
24.69
24.69 Transnational (Pte) Ltd - Singapore
62.96
(Private) Limited (TLRS)
Bank of Ceylon
24.69
Seylan Bank PLC
12.35
Southern Development Financial Company
41.67
41.67 Bank of Ceylon
41.67
Limited (SDFC)
People's Bank
41.67
Southern Development Authority of Sri Lanka
16.66
SDFC is not in operation and in the process of liquidation.
32.5 Summarised financial information of associates
2023
CAML
LSL
TLRS
LKR ‘000
LKR ‘000
LKR ‘000
Statement of profit or loss for the year
Total income
262,685
420,026
314,983
Profit / (loss) before tax
118,550
97,659
12,438
Profit / (loss) after tax
83,334
60,085
(308)
Other comprehensive income
(4,865)
-
-
Total comprehensive income
78,469
60,085
(308)
Statement of financial position as at 31 December
Total assets
890,357
862,433
1,336,915
Current liabilities
93,184
305,487
162,774
Total liabilities
117,383
306,278
711,523
Net assets
772,974
556,155
625,392
Dividend paid during the year
18,674
44,903
-
Dividend received to the Bank (net) during the year
8,097
19,986
-

2022
CAML
LSL
TLRS
LKR ‘000
LKR ‘000
LKR ‘000
Statement of profit or loss for the year
Total income
205,581
543,996
400,295
Profit / (loss) before tax
84,659
200,554
166,592
Profit / (loss) after tax
62,384
144,299
163,111
Other comprehensive income
(46,914)
-
-
Total comprehensive income
15,470
144,299
163,111
Statement of financial position as at 31 December
Total assets
777,942
1,071,304
1,433,427
Current liabilities
42,070
463,464
153,024
Total liabilities
65,558
465,627
799,456
Net assets
712,384
605,677
633,971
Dividend paid during the year
21,448
10,095
-
Dividend received to the Bank (net) during the year
9,300
4,200
-
33
Investment properties
Accounting policy
Recognition
Investment property is property held either to earn rental income or for capital appreciation or for both, but not for sale in the
ordinary course of business, use in the production or supply of goods or services or for administrative purposes.
Measurement
Investment property is accounted for under Cost Model in the Financial Statements. Accordingly, after initial recognition as an asset,
the property is carried at its cost, less accumulated depreciation and impairment losses.
If any property is reclassified to investment property due to changes in its use, fair value of such property at the date of reclassification
becomes its cost for subsequent accounting.
Depreciation
Depreciation is provided on a straight-line basis over the estimated life of the class of asset from the date of purchase up to the date
of disposal. Provision for depreciation is made over the period of 20 years at the rate of 5% per annum using the straight-line method
for buildings classified as investment property. Land is not depreciated under normal circumstances.
Derecognition
Investment properties are derecognised when they are disposed of, or permanently withdrawn from use since no future economic
benefits are expected. Transfers are made to and from investment property only when there is a change in use. When the use of a
property changes such that it is reclassified as Property, Plant and Equipment, its fair value at the date of reclassification becomes its
cost for subsequent accounting.

Bank
Group
2023
2022
2023
2022
LKR ‘000
LKR ‘000
LKR ‘000
LKR ‘000
Cost
Balance as at 1 January
3,003,007
3,003,007
148,409
148,409
Additions during the year
-
-
-
-
Disposal
-
-
(162)
-
Adjustments/ transfers
-
-
-
-
Balance as at 31 December
3,003,007
3,003,007
148,247
148,409
Less : Accumulated depreciation
Balance as at 1 January
588,367
588,367
43,611
40,705
Charge for the year
-
-
9,190
2,906
Balance as at 31 December
588,367
588,367
52,801
43,611
Net investment properties
2,414,640
2,414,640
95,446
104,798
Rental income generated from investment properties for the year 2023 is LKR 32.4 million. (2022 - LKR 24.0 million)
Building value of LKR 588.4 million in Bank's investment property is fully depreciated as at 31.12.2021.
33.1 Unobservable inputs considered in measuring fair value
Significant unobservable inputs
Range of estimates for unobservable inputs
Sensitivity of fair value to unobservable inputs
Estimated value per perch
LKR 12.0 million - LKR 16.0 million
Positively correlated sensitivity
33.2 Investment properties held by the bank and group
33.2.1 Bank
As at 31 December
2023
2022
Land
Cost
Fair value
Cost
Fair value
Number of
extent
Building
Land
Building
Total
total
total
total
Buildings
(Perches)
(Squre feet)
LKR '000
LKR '000
LKR '000
LKR '000
LKR '000
LKR '000
York street building, No.02,
York Street, Colombo 01
1
181.85
261,610
2,414,640
588,367
3,003,007
3,003,007
3,003,007
3,003,007
Total
2,414,640
588,367
3,003,007
3,003,007
3,003,007
3,003,007

33.2.2 Group
As at 31 December
2023
2022
Land
Cost
Fair value
Cost
Fair value
Number of
extent
Building
Land
Building
Total
total
total
total
buildings
(Perches)
(square feet)
LKR '000
LKR '000
LKR '000
LKR '000
LKR '000
LKR '000
No. 64 and 66, Nonagama
Road, Pallegama, Embilipitiya.
-
16.61
-
1,751
-
1,751
-
1,751
-
No. 385/1, Kotte Road,
Pittakotte.
1
19.01
2,896
2,958
1,730
4,688
53,000
4,688
53,000
No. 116/4,116/7,116/26,
116/27,116/29, 1st Cross
Street, Colombo 01.
-
12.35
-
1,249
-
1,249
-
1,249
-
No. 102 and 104, Dam Street,
Colombo 12.
1
50.70
20,368
17,970
11,989
29,959
188,000
29,959
188,000
Kumbuththukuliya watte,
Bangadeniya Road, Puttalam.
-
320.00
-
600
-
600
-
600
-
Mirissawelawatta hena;
Thekkawatta, Dambadeniya.
-
188 .00
-
-
-
-
-
162
-
Fingara Town and Country
Club, No. 50/21, Old Kesba-
wa Road, Boralesgamuwa.
1
364.35
54,826
65,604
44,396
110,000
320,000
110,000
320,000
Total
90,132
58,115
148,247
561,000
148,409
561,000
Note :
The fair value of the investment properties as at 31 December 2023 was based on market valuations carried out in the year 2018
and 2019 by Mr D N Dhammika Baranage [RICS (UK), DIV AIS (SL)] and Mr H A W Perera [B Sc Estate Management and Valuation
(Special)], Mr Samantha Kumara Madawan Arachchi [B Sc Estate Management and Valuation (Special), City Planning (JP), Dip(UPM)
NI, AIREV] and Mr. A G Gunarathne [B.Sc. Estate Mgt and Valuation, F.I.V (Sri Lanka)], Mr L G T Thungasiri [(AIV) F.I.V (Sri Lanka), Dip.
in Valuation (SLTC)], who are independent valuers not connected with the companies. The directors have reviewed values of the
investment properties as at 31 December 2023 and concluded that there was no impairment.
34
Property, plant and equipment
Accounting policy
Recognition
Property, plant and equipment (PPE) are recognised if it is probable that future economic benefits associated with the assets will flow
to the Group and the cost of the asset can be reliably measured.
Measurement
Cost of Property, plant and equipment includes expenditures that are directly attributable to the acquisition of the asset. The cost
of self-constructed assets includes the cost of materials and direct labour, any other costs directly attributable to bringing the assets
to a working condition for their intended use, the costs of dismantling and removing the items and restoring the site on which
they are located. Purchased software that is integral to the functionality of the related equipment is also capitalised as part of that
equipment.
Items of property, plant and equipment are measured at cost less accumulated depreciation and accumulated impairment losses.
Revaluation model is applied for entire class of freehold land and buildings and buildings on leasehold lands. The Market participant’s
ability to generate economic benefits by using the asset in its highest and best use or by selling it to another market participant that
would use the asset in its highest and best use are taken into account in measuring the fair value.

Properties that carried at revaluation amount being their fair value at the date of revaluation, less any subsequent accumulated
depreciation and subsequent accumulated impairment losses. Freehold land and building of the Group are revalued every three
to five years or more frequently if the fair values are substantially different from their carrying amounts to ensure that the carrying
amounts do not differ from the fair values at the reporting date. Any surplus arising on revaluation of an asset is accumulated under
the Revaluation Reserve in Equity through Other Comprehensive Income. However, if there is any revaluation deficit of the same asset
previously recognised on profit or loss, revaluation surplus is recognised on Profit or Loss to the extent it reverse such deficit. Any
deficit arising on revaluation of assets are recognised on Profit or Loss and such deficit is recognised in Other Comprehensive Income
to the extent of any credit balance existing in the revaluation reserve in respect of that asset.
Accumulated depreciation as at revaluation date is eliminated against the gross carrying amount of assets and the net amount
restated to the revalued amount of the assets. Where the carrying value of the property, plant and equipment are reviewed for
impairment, when an event or changes in circumstances indicate that the carrying value may not be recoverable.
When parts of an item of property, plant and equipment have different useful lives, they are accounted for as separate items (major
components) of PPE
Subsequent costs
The cost of replacing a part of an item of PPE is recognised in the carrying amount of the item if it is probable that the future
economic benefits embodied within the part will flow to the Group and its cost can be measured reliably. The costs of the day to
day servicing of property, plant and equipment are recognised in the Statement of Profit or Loss in "Other expenses" (Note 17) as
incurred.
Capital work in progress
Capital work in progress is stated at cost. These are expenses of a capital nature directly incurred in the construction of buildings,
awaiting capitalisation.
Borrowing costs
Borrowing costs directly attributable to the acquisition, construction or production of an asset that necessarily takes a substantial
period of time to get ready for its intended use or sale are capitalised as part of the cost of the asset. All other borrowing costs are
expensed in the period in which they occur. Borrowing costs consist of interest and other costs that the bank incurs in connection with
the borrowing of funds.
Depreciation
Depreciation is recognised in Statement of Profit or Loss on a straight line basis over the estimated useful lives of each part of an item
of Property, Plant and Equipment since this method most closely reflects the expected pattern of consumption of the future economic
benefits embodied in the asset. Leased assets under finance leases are depreciated over the shorter of the lease term and their useful
lives. Land is not depreciated. Further, cost of expansion and major renovations on the building are depreciated over the remaining
useful lives of the original buildings.
Provisioning for depreciation of PPE is made on pro rata basis.
The Group’s estimated useful lives for the current and comparative periods are as follows:
Freehold buildings
40 - 60 years
Office equipment
03-08 years
Furniture and fittings
08 years
Computer equipment
04-05 years
Motor vehicles
04 years
Depreciation methods, useful lives and residual values are reassessed at each financial year end and adjusted if appropriate.

Useful life and residual values
Residual value is the amount that Group could receive for an asset at the reporting date if the asset was already at the age and in the
condition that it will be in when the Group expects to dispose it.
The residual and useful life of an asset are reviewed at least at each reporting date, changes in the residual value and useful life are
accounted for prospectively as a change in an accounting estimate only if the residual value is material.
Derecognition
The carrying amount of an item of property, plant and equipment is derecognised on disposal, replacement or when no future
economic benefits are expected from its use. The gain or loss arising from the derecognition of an item of property, plant and
equipment is included in the "Net Other operating income" (Note 13) / "Other expenses" (Note 17) in the Statement of Profit or
Loss in the year the item is derecognised.
Reclassification as investment property
When the use of property changes such that is reclassified as investment property, its fair value at the date of reclassification becomes
its cost for subsequent accounting. Any gain arising on re-measurement is recognised in the Statement of Profit or Loss to the extent
that it reverses a previous impairment loss on the specific property, with any remaining gain recognised in Other Comprehensive
Income and presented in revaluation reserve in equity. Any loss is recognised immediately in the Statement of Profit or Loss.
34.1 Bank
Freehold
land
Freehold
building
Buildings on
leasehold
land
Equipment
[Note
34.12.1]
Motor
vehicles
Leasehold
motor
vehicles
Capital
work in
progress
2023
Total
2022
Total
LKR '000
LKR '000
LKR '000
LKR '000
LKR '000
LKR '000
LKR '000
LKR '000
LKR '000
Cost or valuation
As at 1 January
20,264,953
4,816,358
4,040,757
20,615,419
1,666,180
37,548
996,120
52,437,335
48,791,997
Additions during the year
Acquisitions
-
59,980
23,563
1,872,334
-
-
1,221,853
3,177,730
2,243,640
Capitalisations
-
984,553
175,591
-
-
-
(1,160,144)
-
-
Changes in revaluation surplus/
(deficit)
5,556,239
982,746
-
-
-
-
-
6,538,985
1,703,545
Transfer of accumulated
depreciation on revalued assets
-
(431,721)
-
-
-
-
-
(431,721)
(381,858)
Disposals during the year
-
-
(10,100)
(147,682)
-
-
-
(157,782)
(198,149)
Exchange rate adjustments
-
-
-
(66,912)
(3,245)
-
-
(70,157)
265,622
Transfers / adjustments
-
-
(73,441)
-
-
-
(65,966)
(139,407)
12,538
As at 31 December
25,821,192
6,411,916
4,156,370
22,273,159
1,662,935
37,548
991,863
61,354,983
52,437,335
Accumulated depreciation
As at 1 January
-
286,454
157,923
15,484,894
1,625,512
37,548
-
17,592,331
16,034,513
Charge for the year
-
158,549
1,531,909
1,531,909
27,152
-
-
1,846,426
1,894,960
Transfer of accumulated
depreciation on revalued assets
-
(431,721)
-
-
-
-
-
(431,721)
(381,858)
Disposals during the year
-
-
(1,683)
(87,858)
-
-
-
(89,541)
(188,711)
Exchange rate adjustments
-
-
-
(62,008)
(2,942)
-
-
(64,950)
233,369
Transfers / adjustments
-
-
(62,201)
141
-
-
-
(62,060)
58
As at 31 December
-
13,282
222,855
16,867,078
1,649,722
37,548
-
18,790,485
17,592,331
Net book value as at
31 December 2023
25,821,192
6,398,634
3,933,515
5,406,081
13,213
-
991,863
42,564,498
Net book value as at
31 December 2022
20,264,953
4,529,904
3,882,834
5,130,525
40,668
-
996,120
34,845,004

34.2 Group
Freehold
land
Freehold
building
Buildings on
leasehold
land
Equipment
[Note
34.12.2]
Motor
vehicles
Leasehold
motor
vehicles
Capital
work in
progress
2023
Total
2022
Total
LKR '000
LKR '000
LKR '000
LKR '000
LKR '000
LKR '000
LKR '000
LKR '000
LKR '000
Cost or valuation
As at 1 January
23,776,441
8,788,052
14,192,604
22,235,203
1,859,078
60,924
1,057,065
71,969,367
65,982,339
Additions during the year
Acquisitions
-
59,980
23,563
1,970,813
-
-
1,523,754
3,578,110
3,167,824
Capitalisations
-
984,549
175,591
-
-
-
(1,160,140)
-
-
Changes in revaluation
surplus/ (deficit)
5,556,239
1,849,423
887,725
-
-
-
-
8,293,387
3,001,630
Transfer of accumulated
depreciation on revalued assets
-
(497,424)
(547,022)
-
-
-
-
(1,044,446)
(957,878)
Disposals during the year
-
-
(10,100)
(165,677)
-
-
(358,263)
(534,040)
(205,411)
Exchange rate adjustments
(52,806)
(37,102)
-
(119,790)
(3,245)
-
-
(212,943)
964,904
Transfers / adjustments
(149,112)
(344,089)
(29,501)
35,612
(393)
640
660,458
173,615
15,959
As at 31 December
29,130,762
10,803,389
14,692,860
23,956,161
1,855,440
61,564
1,722,874
82,223,050
71,969,367
Accumulated depreciation
As at 1 January
-
1,438,530
898,057
16,802,220
1,777,707
60,530
-
20,977,044
19,038,148
Charge for the year
-
178,164
675,838
1,639,512
39,629
-
159,529
2,692,672
2,717,917
Transfer of accumulated
depreciation on revalued assets
-
(497,424)
(547,022)
-
-
-
-
(1,044,446)
(957,878)
Disposals during the year
-
-
(1,683)
(104,235)
-
-
(339,592)
(445,510)
(188,711)
Exchange rate adjustments
-
-
-
(62,009)
(2,943)
-
-
(64,952)
361,269
Transfers / adjustments
-
66,503
(62,200)
43,669
19,778
(4,585)
478,179
541,344
6,299
As at 31 December
-
1,185,773
962,990
18,319,157
1,834,171
55,945
298,116
22,656,152
20,977,044
Net book value as at
31 December 2023
29,130,762
9,617,616
13,729,870
5,637,004
21,269
5,619
1,424,758
59,566,898
Net book value as at
31 December 2022
23,776,441
7,349,522
13,294,547
5,432,983
81,371
394
1,057,065
50,992,323

34.3 Title restriction on property, plant and equipment
There were no restrictions that existed in the title of the property, plant and equipment of the Bank and the Group as at the reporting
date.
34.4 Property, plant and equipment pledged as security for liabilities
No freehold property, plant and equipment have been pledged as security for any liability.
34.5 Compensation from third parties for items of property, plant and equipment
There were no compensation received / receivable from third parties for items of Property, Plant and Equipment which were impaired
or given up
34.6 Fully depreciated property, plant and equipment
The initial cost of fully depreciated property, plant and equipment which are still in use are as follows ;
Bank
Group
As at 31 December
2023
2022
2023
2022
LKR ‘000
LKR ‘000
LKR ‘000
LKR ‘000
Motor vehicles
1,563,711
1,563,711
1,585,113
1,751,625
Computer equipments
7,177,586
6,334,878
7,190,481
7,048,750
Equipment, furniture, and fittings
2,573,922
2,374,110
2,599,473
2,980,141
Buildings on leasehold lands
600,256
626,069
600,256
626,069
Plant and machinery
2,028,506
1,817,005
2,029,934
2,405,900
Total
13,943,981
12,715,773
14,005,257
14,812,485
34.7 Temporarily idle property, plant and equipment
There were no temporarily idle property, plant and equipment as at the reporting date.
34.8 Property, plant and equipment retired from active use
The Group held no property, plant and equipment retired from active use and which were not classified as held for sale in accordance
with SLFRS 5 -" Non-current assets held for sale and discontinued operations".
34.9 Freehold properties
The carrying value of freehold properties, that would have been recognised in the Financial Statements, if they were carried at cost
less accumulated depreciation is as follows ;
34.9.1 Bank
As at 31 December
2023
2022
Cost
Accumulated
depreciation
Net book
value
Cost
Accumulated
depreciation
Net book
value
LKR '000
LKR '000
LKR '000
LKR '000
LKR '000
LKR '000
Land
2,172,855
-
2,172,855
2,172,855
-
2,172,855
Building
3,917,433
(1,120,934)
2,796,499
2,872,904
(962,385)
1,910,519
Total
6,090,288
(1,120,934)
4,969,354
5,045,759
(962,385)
4,083,374
34.9.2 Group
As at 31 December
2023
2022
Cost
Accumulated
depreciation
Net book
value
Cost
Accumulated
depreciation
Net book
value
LKR '000
LKR '000
LKR '000
LKR '000
LKR '000
LKR '000
Land
2,103,203
-
2,103,203
2,305,121
-
2,305,121
Building
4,785,710
(2,056,531)
2,729,179
4,122,372
(1,819,102)
2,303,270
Total
6,888,913
(2,056,531)
4,832,382
6,427,493
(1,819,102)
4,608,391
34.10 Revaluation of leasehold / freehold properties - Group
The following buildings on leasehold / freehold lands of the subsidiaries were revalued during the year by professionally qualified
independent valuers.
Leasehold properties
2023
Details of properties
Valuer
Basis of
valuation
Carrying
value
Revalued
amount of
Building
Surplus/
(Loss)
of Building
LKR '000
LKR '000
LKR '000
Property Development Limited Bank of
Ceylon Head Office Building
"BOC Square", Colombo 01 (Revalued as
at 31 December 2023)
P P T Mohideen
Discounted
Cash Flow
method
8,292,075
9,014,000
721,925
BOC Property Development and
Management (Private) Limited
Bank of Ceylon - Ceybank house
No. 86, Sri Dalada Veediya, Kandy
(Revalued as at 31 December 2023)
P P T Mohideen
Discounted
Cash Flow
method
620,800
786,600
165,800

Freehold Buildings
2023
Details of properties
Valuer
Basis of
valuation
Carrying
value
Revalued
amount of
Building
Surplus/
(Loss)
of Building
LKR '000
LKR '000
LKR '000
BOC Property Development and
Management (Private) Limited
Bank of Ceylon - Merchant Tower
St. Micheal's Road, Colombo 03
(Revalued as at 31 December 2023)
P P T Mohideen
Discounted
cash flow
method
2,162,827
3,029,500
866,673
34.11 Unobservable inputs considered in measuring fair value
The following table depicts information about significant unobservable inputs used in measuring fair value of the assets categorised
under Level 3 of the fair value hierarchy.
34.11.1 Bank
2023
Type of asset
Fair value as at
31.12.2023
LKR'000
Valuation technique
Significant unobservable
inputs
Range of estimates for
unobservable inputs
Sensitivity of fair value to
unobservable inputs
Freehold land
25,821,192
Contractor's method
Estimated cost per perch
LKR 80,000 - LKR
50,000,000
Positively correlated
sensitivity
Freehold buildings
6,398,634
Contractor's method
Estimated cost per square
feet
LKR 960 - LKR 63,000
Positively correlated
sensitivity
Buildings on
leasehold lands
3,933,515
Rental value basis
Estimated rental value per
square feet
LKR 110 - LKR 11,250
Positively correlated
sensitivity
Expected market
rental growth p.a
5%
Positively correlated
sensitivity
Anticipated maintenance
cost
40%
Positively correlated
sensitivity
Discount rate
6%
Negatively correlated
sensitivity
34.11.2 Group
2023
Type of asset
Fair value as at
31.12.2023
LKR'000
Valuation technique
Significant unobservable
inputs
Range of estimates for
unobservable inputs
Sensitivity of fair value
to unobservable inputs
Freehold land
29,130,762
Market comparable
method
Estimated cost per perch
LKR 50,000 -
LKR 20,000,000
Positively correlated
sensitivity
Freehold buildings
9,783,416
Discounted cash flow
method
Estimated cost per square
feet
LKR 600 - LKR 59,000
Positively correlated
sensitivity
Buildings on
leasehold lands
13,564,070
Discounted cash flow
method
Estimated rental value per
square feet
LKR 110 -
LKR 11,250
Positively correlated
sensitivity
Expected market
rental growth p.a
5% -7.5%
Positively correlated
sensitivity
Anticipated maintenance
cost
40%
Positively correlated
sensitivity
Discount rate
5.5% -10%
Negatively correlated
sensitivity
34.12 Equipment
34.12.1 Bank
Computer
Equipment
Furniture
and
Fittings
Office
Equipment
2023
Total
2022
Total
LKR '000
LKR '000
LKR '000
LKR '000
LKR '000
Cost
Balance as at 1 January
10,963,643
6,185,307
3,466,469
20,615,419
18,971,479
Additions during the year
Acquisitions
896,056
605,753
370,525
1,872,334
1,551,530
Capitalisations
-
-
-
-
-
Disposals during the year
(94,899)
(29,528)
(23,255)
(147,682)
(157,555)
Exchange rate adjustments
(55,844)
(3,675)
(7,393)
(66,912)
249,965
Transfers / adjustments
-
-
-
-
-
Balance as at 31 December
11,708,956
6,757,857
3,806,346
22,273,159
20,615,419
Accumulated depreciation
Balance as at 1 January
8,763,469
4,038,887
2,682,538
15,484,894
13,842,468
Charge for the year
841,579
486,958
203,372
1,531,909
1,577,646
Disposals during the year
(37,954)
(26,821)
(23,083)
(87,858)
(155,670)
Exchange rate adjustments
(51,512)
(6,041)
(4,455)
(62,008)
220,450
Transfers / adjustments
-
141
-
141
-
Balance as at 31 December
9,515,582
4,493,124
2,858,372
16,867,078
15,484,894
Net book value as at 31 December 2023
2,193,374
2,264,733
947,974
5,406,081
Net book value as at 31 December 2022
2,200,174
2,146,420
783,931
5,130,525
34.12.2 Group
Computer
Equipment
Furniture
and
Fittings
Office
Equipment
2023
Total
2022
Total
LKR '000
LKR '000
LKR '000
LKR '000
LKR '000
Cost
Balance as at 1 January
11,621,195
7,089,282
3,524,726
22,235,203
20,454,368
Additions during the year
Acquisitions
929,484
667,157
374,172
1,970,813
1,595,550
Capitalisation
-
-
-
-
-
Disposals during the year
(98,354)
(43,782)
(23,541)
(165,677)
(158,049)
Exchange rate adjustments
(103,766)
(8,627)
(7,397)
(119,790)
343,103
Transfers / Adjustments
178,660
(134,348)
(8,700)
35,612
231
Balance as at 31 December
12,527,219
7,569,682
3,859,260
23,956,161
22,235,203
Accumulated depreciation
Balance as at 1 January
9,327,344
4,724,108
2,750,768
16,802,220
15,013,011
Charge for the year
873,596
533,155
232,761
1,639,512
1,659,018
Disposals during the year
(41,375)
(39,707)
(23,153)
(104,235)
(155,670)
Exchange rate adjustments
(51,512)
(6,043)
(4,454)
(62,009)
285,861
Transfers / Adjustments
187,118
(143,468)
19
43,669
-
Balance as at 31 December
10,295,171
5,068,045
2,955,941
18,319,157
16,802,220
Net book value as at 31 December 2023
2,232,048
2,501,637
903,319
5,637,004
Net book value as at 31 December 2022
2,293,851
2,365,174
773,958
5,432,983

34.13 The details of Freehold land and building held by the bank as at 31 December 2023 are as follows:
Name of Premises
Number
of
Buildings
Land
Extent
(Perches)
Building
(Square
feet)
Date of
valuation
Valuer
Basis of Valuation
Central Province
Galaha Branch, 59/37, Deltota Road, Galaha
1
15.00
8,410 30.11.2023 R H Jayawardana
Contractor's Method
Gampola Branch, 44, Kadugannawa Road, Gampola
1
175.00
11,404 30.11.2023 R A R M N Rajakaruna
Contractor's Method
Galewela Branch, 158, Dhambulla Road, Galewela
1
47.00
6,958 30.11.2023 R A R M N Rajakaruna
Contractor's Method
Hatton Branch and staff Quarters, 46, Circular Road, Hatton
2
139.57
11,041 30.11.2023 R H Jayawardana
Contractor's Method
Kandy 2nd City Branch, Ceybank House ,88, Dalada Veediya, Kandy
1
42.81
33,589 30.11.2023 R A R M N Rajakaruna
Contractor's Method
Kandapola Branch, 31,33, Main Street , Kandapola
1
14.10
5,248 30.11.2023 R H Jayawardana
Contractor's Method
Maskeliya Branch, 66, Upcot Road, Maskeliya
1
42.05
6,607 30.11.2023 R H Jayawardana
Contractor's Method
Nawalapitiya Branch, 6, Gampola Road, Nawalapitiya
1
21.92
9,790 30.11.2023 R A R M N Rajakaruna
Contractor's Method
Nuwara Eliya Branch, 43, Lawson Street, Nuwara Eliya
1
133.50
9,859 30.11.2023 R H Jayawardana
Contractor's Method
Nuwara Eliya Staff Quarters, 14,19, Hill Street, Nuwara Eliya
1
41.40
4,847 30.11.2023 R H Jayawardana
Contractor's Method
Nuwara Eliya Property Ladies staff Quarters, 12, Hill Street,
Nuwara Eliya
1
14.99
1,303 30.11.2023 R H Jayawardana
Contractor's Method
Rikillagaskada Branch, 3, Dimbulkubura Road, Rikillagaskada
1
19.60
6,487 30.11.2023 R A R M N Rajakaruna
Cost Method
Thalawakele Branch, 23,25,29, Hatton Road, Talawakelle
1
25.30
7,332 30.11.2023 R H Jayawardana
Contractor's Method
Thalawakele Staff Quarters, Talawakele Estate, Thalawakale
1
160.00
4,898 30.11.2023 R H Jayawardana
Contractor's Method
Eastern Province
Batticaloa Branch, 19, Govington Road, Batticaloa
1
64.85
9,585 30.11.2023 P Santhirasegaram
Contractor's Method
Mutur Branch (New), 36/1 Trincomalee Road ,Ward No 07, Mutur
1
71.00
9,532 30.11.2023 P P T Mohideen
Contractor's Method
Potuvil Branch, Main Street, Pottuvil
1
10.70
4,500 30.11.2023 P Santhirasegaram
Contractor's Method
Trincomalee Branch, 24, Inner Harbour Road, Trincomalee
1
90.00
10,810 30.11.2023 P P T Mohideen
Contractor's Method
Trincomalee City Branch, 09, Main Street, Trincomalee
1
21.90
9,620 30.11.2023 P P T Mohideen
Contractor's Method
Valachchenai Branch, Main Street, Valachchenai
1
47.34
6,621 30.11.2023 P Santhirasegaram
Contractor's Method
Northern Province
Jaffna Area Office & Branch, 476,476A,Hospital Road, Jaffna
2
166.25 23,641 30.11.2023 P P T Mohideen
Contractor's Method
Jaffna 2nd Branch, 56, Stanley Road, Jaffna
1
33.89 17,361 30.11.2023 P P T Mohideen
Contractor's Method
Karainagar Branch, Post Office View, Karainagar
1
20.09
3,170 30.11.2023 P P T Mohideen
Contractor's Method
Mannar Branch (Land), Moor Street, Mannar
-
63.22
- 30.11.2023 P P T Mohideen
Contractor's Method
Nelliadi Branch, 23, Kodikamam Road, Nelliady
1
42.74 10,889 30.11.2023 P P T Mohideen
Contractor's Method
North Western Province
Alawwa Branch, 64, Giriulla Road, Alawwa
1
30.80
7,011 30.11.2023 R W M S B Rajapaksha
Contractor's Method
Bingiriya Land, 44 ,Chilaw Road, Bingiriya
-
40.00
- 30.11.2023 R W M S B Rajapaksha
Comparison's Method
Chilaw Branch, Radaguru Edmund Peiris Mawatha, Chilaw
1
38.25
8,935 30.11.2023 R W M S B Rajapaksha
Contractor's Method
Dankotuwa Branch (Land), 01/60, Negombo Road, Dankotuwa
-
32.90
- 30.11.2023 R W M S B Rajapaksha
Comparison's Method
Carrying value
of Land
Revalued
Amount of Land
Revaluation
Surplus/ (Loss)
of Land
Carrying
value of
Buildings
Revalued
Amount /
Carrying value
of Buildings
Revaluation
Surplus/(Loss)
of Buildings
Total
Revaluation
Surplus/ (Loss)
Total Revalued
Amount /
Carrying Value
LKR '000
LKR '000
LKR '000
LKR '000
LKR '000
LKR '000
LKR '000
LKR '000
22,500
25,500
3,000
26,853
46,500
19,647
22,647
72,000
245,000
279,000
34,000
23,915
73,250
49,335
83,335
352,250
117,500
145,000
27,500
54,768
119,750
83,115
137,115
414,750
642,850
1,403,505
35,000
35,250
250
17,300
33,161
15,861
16,111
68,411
42,000
50,460
8,460
20,414
37,470
17,056
25,516
87,930
54,800
53,000
(1,800)
32,601
27,000
(5,601)
(7,401)
80,000
867,750
934,500
66,750
35,964
68,816
32,852
99,602
1,003,316
103,500
111,780
8,280
13,918
32,200
18,282
26,562
143,980
11,242
14,990
3,748
3,796
9,960
6,164
9,912
24,950
30,199
41,380
11,181
13,591
20,006
6,415
19,090
66,799
27,492
14,594
16,194
40,292
2,501,631
3,390,935
889,304
437,849
693,549
255,700
1,145,004
4,084,484
64,850
130,000
65,150
20,125
30,000
9,875
75,025
160,000
24,850
31,172
6,322
41,991
56,745
14,754
21,076
87,917
24,075
32,100
8,025
16,931
15,900
(1,031)
6,994
48,000
99,000
103,500
4,500
21,853
27,858
6,005
10,505
131,358
38,325
47,540
9,215
86,029
76,960
(9,069)
146
124,500
37,872
88,900
51,028
16,925
11,975
(4,950)
46,078
100,875
288,972
433,212
144,240
203,854
219,438
15,584
159,824
652,650
540,000
540,310
310
29,871
37,490
7,619
7,929
577,800
186,000
177,900
(8,100)
72,453
65,100
(7,353)
(15,453)
243,000
5,000
7,858
2,858
9,670
9,842
172
3,030
17,700
35,000
41,100
6,100
-
-
-
6,100
41,100
60,000
34,200
(25,800)
50,875
66,550
15,675
(10,125)
100,750
826,000
801,368
(24,632)
162,869
178,982
16,113
(8,519)
980,350
54,000
69,000
15,000
20,350
31,000
10,650
25,650
100,000
30,000
40,000
10,000
-
-
-
10,000
40,000
76,500
86,000
9,500
26,363
38,000
11,637
21,137
124,000
65,800
65,800
-
-
-
-
65,800

Name of Premises
Number
of
Buildings
Land
Extent
(Perches)
Building
(Square
feet)
Date of
valuation
Valuer
Basis of Valuation
Dummalasooriya Branch, 227, Kuliyapitiya - Madampe Road,
Dummalasuriya
1
41.68
6,139 30.11.2023 R W M S B Rajapaksha
Contractor's Method
Kurunegala Province Office, AGM's Quarters & CM Quarters,
18, Mihindu Mawatha, Kurunegala
3
225.00
20,575 30.11.2023 S R Yoganathan
Comparison's Method
Kurunegala Super Grade Branch, Commercial Complex,
Kurunegala
1
- 12,242 30.11.2023 S R Yoganathan
Comparison's Method
Kurunegala 2nd City Branch, 35, Colombo Road, Kurunegala
1
49.40
29,294 30.11.2023 S R Yoganathan
Comparison's Method
Madampe Branch, 10, Station Road, Madampe
1
61.10
7,680 30.11.2023 S Hapugoda
Contractor's Method
Madurankuliya Branch, 66 , Colombo Road, Madurankuliya
1
46.00
5,760 30.11.2023 S Hapugoda
Contractor's Method
Malsiripura Branch, 362, 358, Dambulla Road, Malsiripura
1
46.20
7,780 30.11.2023 S R Yoganathan
Comparison's Method
Marawila Branch (Land), 85, Negombo Road, Marawila
-
35.00
- 30.11.2023 S Hapugoda
Contractor's Method
Narammala Branch, 139, Negombo Road, Narammala
1
117.50
7,959 30.11.2023 S R Yoganathan
Contractor's Method
Nattandiya Branch (Land), 115, Marawila Road, Nattandiya
-
40.00
- 30.11.2023 S Hapugoda
Contractor's Method
Waikkal Branch (Land), 43/44, Thopputota, Waikkal
-
36.00
- 30.11.2023 S Hapugoda
Contractor's Method
Wariyapola Branch (Land), 32,Kurunegala Road , Wariyapola
-
40.80
- 30.11.2023 S R Yoganathan
Comparison's Method
Sabaragamuwa Province
Balangoda Branch, 137, 139 Main Street, Balangoda
1
14.50
3,520 30.11.2023 A G Gunaratna
On Market Approach
Dehiowita Branch, 62 Main Street, Dehiowita
1
38.60
4,511 30.11.2023 A G Gunaratna
Cost Approach
Kegalle Branch, 110, Colombo Road, Kegalle
1
131.38
17,250 30.11.2023 W A T I P Jayathilake
Contractor's Method
Ratnapura Branch, 6, Dharmapala Mawatha, Ratnapura
1
99.70
11,082 30.11.2023 W A T I P Jayathilake
Contractor's Method
Rathnapura Branch (Land), 25,Shaviya Mawatha, Rathanapura
-
31.69
- 30.11.2023 W A T I P Jayathilake
Contractor's Method
Southern Province
Ambalangoda Branch, 345,Galle Raod, Ambalangoda
1
58.00
6,330 30.11.2023 U Rajapaksha
Contractor's Method
Ambalantota Branch, 11, Wanduruppa Road, Ambalantota
1
38.00
5,410 30.11.2023 U Rajapaksha
Contractor's Method
Ahangama Branch, 54,Galle Road , Ahangama
1
33.35
5,035 30.11.2023 U Rajapaksha
Contractor's Method
Batapola Branch, Aluthwatte , Batapola
1
46.80
3,024 30.11.2023 U Rajapaksha
Contractor's Method
Beliatta Branch, 67, Walasmulla Road, Beliatta
1
53.02
6,200 30.11.2023 U Rajapaksha
Contractor's Method
Deniyaya Land, Viharahena Road, Deniyaya
-
55.80
- 30.11.2023 U Rajapaksha
Comparison Method
Galle Province Office, 20, Hospital Street ,Fort, Galle
1
32.63
14,250 30.11.2023 U Rajapaksha
Contractor's Method
Galle Branch, 2, Light House Street , Fort ,Galle
1
31.50
16,200 30.11.2023 U Rajapaksha
Contractor's Method
Galle City Land, 7,Sri Dewamitta Mawatha,Galle
-
27.14
- 30.11.2023 D P L C De Silva
Contractor's Method
Hakmana Branch, Beliatta Road, Hakmana
1
36.70
3,400 30.11.2023 U Rajapaksha
Contractor's Method
I
maduwa Branch, Ahangama Road, Imaduwa
1
83.50
3,395 30.11.2023 U Rajapaksha
Contractor's Method
Karapitiya Land, 167A, Hirimbura Cross Road, Karapitiya
-
35.00
- 28.12.2023 D P L C De Silva
Comparison Method
Matara Super Grade Branch & Southern Province Office, 11,
Kumaratunga Mawatha, Matara
1
104.40
52,969 30.11.2023 U Rajapaksha
Contractor's Method
Matara Bazzar Branch, 58,New Tanglle Road, Matara
1
49.25
6,920 30.11.2023 U Rajapaksha
Contractor's Method
Nagoda Branch, Mapalagama Road, Nagoda
1
40.00
3,132 30.11.2023 W A T I P Jayathilake
Contractor's Method

Name of Premises
Number
of
Buildings
Land
Extent
(Perches)
Building
(Square
feet)
Date of
valuation
Valuer
Basis of Valuation
Carrying value
of Land
Revalued
Amount of Land
Revaluation
Surplus/ (Loss)
of Land
Carrying
value of
Buildings
Revalued
Amount /
Carrying value
of Buildings
Revaluation
Surplus/(Loss)
of Buildings
Total
Revaluation
Surplus/ (Loss)
Total Revalued
Amount /
Carrying Value
LKR '000
LKR '000
LKR '000
LKR '000
LKR '000
LKR '000
LKR '000
LKR '000
Dummalasooriya Branch, 227, Kuliyapitiya - Madampe Road,
Dummalasuriya
1
41.68
6,139 30.11.2023 R W M S B Rajapaksha Contractor's Method
41,500
62,500
21,000
21,738
31,000
9,262
30,262
93,500
Kurunegala Province Office, AGM's Quarters & CM Quarters,
18, Mihindu Mawatha, Kurunegala
3
225.00 20,575 30.11.2023 S R Yoganathan
Comparison's Method
1,012,500
630,000
(382,500)
88,397
108,000
19,603
(362,897)
738,000
Kurunegala Super Grade Branch, Commercial Complex,
Kurunegala
1
- 12,242 30.11.2023 S R Yoganathan
Comparison's Method
-
-
-
207,755
278,000
70,245
70,245
278,000
Kurunegala 2nd City Branch, 35, Colombo Road, Kurunegala
1
49.40 29,294 30.11.2023 S R Yoganathan
Comparison's Method
468,000
530,000
62,000
379,523
347,000
(32,523)
29,477
877,000
Madampe Branch, 10, Station Road, Madampe
1
61.10
7,680 30.11.2023 S Hapugoda
Contractor's Method
61,000
60,550
(450)
26,212
43,000
16,788
16,338
103,550
Madurankuliya Branch, 66 , Colombo Road, Madurankuliya
1
46.00
5,760 30.11.2023 S Hapugoda
Contractor's Method
62,100
80,000
17,900
30,248
59,000
28,752
46,652
139,000
Malsiripura Branch, 362, 358, Dambulla Road, Malsiripura
1
46.20
7,780 30.11.2023 S R Yoganathan
Comparison's Method
69,000
97,000
28,000
43,890
90,000
46,110
74,110
187,000
Marawila Branch (Land), 85, Negombo Road, Marawila
-
35.00
- 30.11.2023 S Hapugoda
Contractor's Method
61,250
52,500
(8,750)
-
-
-
(8,750)
52,500
Narammala Branch, 139, Negombo Road, Narammala
1
117.50
7,959 30.11.2023 S R Yoganathan
Contractor's Method
92,750
164,000
71,250
35,844
73,000
37,156
108,406
237,000
Nattandiya Branch (Land), 115, Marawila Road, Nattandiya
-
40.00
- 30.11.2023 S Hapugoda
Contractor's Method
60,000
60,000
-
-
-
-
-
60,000
Waikkal Branch (Land), 43/44, Thopputota, Waikkal
-
36.00
- 30.11.2023 S Hapugoda
Contractor's Method
60,000
50,000
(10,000)
-
-
-
(10,000)
50,000
Wariyapola Branch (Land), 32,Kurunegala Road , Wariyapola
-
40.80
- 30.11.2023 S R Yoganathan
Comparison's Method
100,000
112,000
12,000
-
-
-
12,000
112,000
2,314,400
2,159,350
(155,050)
880,320
1,098,000
217,680
62,630
3,257,350
Sabaragamuwa Province
Balangoda Branch, 137, 139 Main Street, Balangoda
1
14.50
3,520 30.11.2023 A G Gunaratna
On Market Approach
36,200
80,000
43,800
2,170
-
(2,170)
41,630
80,000
Dehiowita Branch, 62 Main Street, Dehiowita
1
38.60
4,511 30.11.2023 A G Gunaratna
Cost Approach
20,090
24,050
3,960
1,356
7,358
6,002
9,962
31,408
Kegalle Branch, 110, Colombo Road, Kegalle
1
131.38 17,250 30.11.2023 W A T I P Jayathilake
Contractor's Method
350,000
428,500
78,500
49,647
106,500
56,853
135,353
535,000
Ratnapura Branch, 6, Dharmapala Mawatha, Ratnapura
1
99.70 11,082 30.11.2023 W A T I P Jayathilake
Contractor's Method
110,000
149,600
39,600
32,083
49,900
17,817
57,417
199,500
Rathnapura Branch (Land), 25,Shaviya Mawatha, Rathanapura
-
31.69
- 30.11.2023 W A T I P Jayathilake
Contractor's Method
118,000
166,400
48,400
-
-
-
48,400
166,400
634,290
848,550
214,260
85,256
163,758
78,502
292,762
1,012,308
Southern Province
Ambalangoda Branch, 345,Galle Raod, Ambalangoda
1
58.00
6,330 30.11.2023 U Rajapaksha
Contractor's Method
116,000
156,600
40,600
36,584
53,400
16,816
57,416
210,000
Ambalantota Branch, 11, Wanduruppa Road, Ambalantota
1
38.00
5,410 30.11.2023 U Rajapaksha
Contractor's Method
47,500
76,000
28,500
16,807
32,110
15,303
43,803
108,110
Ahangama Branch, 54,Galle Road , Ahangama
1
33.35
5,035 30.11.2023 U Rajapaksha
Contractor's Method
40,000
58,400
18,400
73,632
50,350
(23,282)
(4,882)
108,750
Batapola Branch, Aluthwatte , Batapola
1
46.80
3,024 30.11.2023 U Rajapaksha
Contractor's Method
70,200
82,600
12,400
12,230
22,500
10,270
22,670
105,100
Beliatta Branch, 67, Walasmulla Road, Beliatta
1
53.02
6,200 30.11.2023 U Rajapaksha
Contractor's Method
101,436
121,000
19,564
36,134
59,900
23,766
43,330
180,900
Deniyaya Land, Viharahena Road, Deniyaya
-
55.80
- 30.11.2023 U Rajapaksha
Comparison Method
57,224
80,000
22,776
-
-
-
22,776
80,000
Galle Province Office, 20, Hospital Street ,Fort, Galle
1
32.63 14,250 30.11.2023 U Rajapaksha
Contractor's Method
261,000
489,400
228,400
21,803
36,600
14,797
243,197
526,000
Galle Branch, 2, Light House Street , Fort ,Galle
1
31.50 16,200 30.11.2023 U Rajapaksha
Contractor's Method
252,000
533,460
281,460
24,939
47,090
22,151
303,611
580,550
Galle City Land, 7,Sri Dewamitta Mawatha,Galle
-
27.14
- 30.11.2023 D P L C De Silva
Contractor's Method
141,200
1,357,000
1,215,800
-
-
-
1,215,800
1,357,000
Hakmana Branch, Beliatta Road, Hakmana
1
36.70
3,400 30.11.2023 U Rajapaksha
Contractor's Method
49,500
55,100
5,600
10,638
15,900
5,262
10,862
71,000
I
maduwa Branch, Ahangama Road, Imaduwa
1
83.50
3,395 30.11.2023 U Rajapaksha
Contractor's Method
62,600
75,150
12,550
9,006
17,350
8,344
20,894
92,500
Karapitiya Land, 167A, Hirimbura Cross Road, Karapitiya
-
35.00
- 28.12.2023 D P L C De Silva
Comparison Method
77,000
157,500
80,500
-
-
-
80,500
157,500
Matara Super Grade Branch & Southern Province Office, 11,
Kumaratunga Mawatha, Matara
1
104.40 52,969 30.11.2023 U Rajapaksha
Contractor's Method
395,400
447,600
52,200
367,248
460,900
93,652
145,852
908,500
Matara Bazzar Branch, 58,New Tanglle Road, Matara
1
49.25
6,920 30.11.2023 U Rajapaksha
Contractor's Method
153,750
191,150
37,400
40,449
60,335
19,886
57,286
251,485
Nagoda Branch, Mapalagama Road, Nagoda
1
40.00
3,132 30.11.2023 W A T I P Jayathilake
Contractor's Method
20,000
28,000
8,000
9,897
26,800
16,903
24,903
54,800

Name of Premises
Number
of
Buildings
Land
Extent
(Perches)
Building
(Square
feet)
Date of
valuation
Valuer
Basis of Valuation
Ranna Land, Main street , Ranna
-
40.00
- 30.11.2023 U Rajapaksha
Comparison Method
Tangalle Branch, 91/1, 91/2 , Tissa Road , Tangalle
1
21.05
5,370 30.11.2023 U Rajapaksha
Contractor's Method
Weeraketiya Branch, Belliatta Road, Weeraketiya
1
36.87
4,480 30.11.2023 U Rajapaksha
Contractor's Method
Weligama Branch, 239, Main Street, Weligama
1
97.75
8,394 30.11.2023 U Rajapaksha
Contractor's Method
Walasmulla Branch, 28, Beliatta Road , Walasmulla
1
38.00
8,045 30.11.2023 U Rajapaksha
Contractor's Method
Uva Province
AGMs Quarters UVA Province Office, 1/90 Bandarawela
Road, Badulla
1
220.00
3,836 30.11.2023 L H Lickson
Investment &
Contractor's Method
Badulla Uva Pro. Office, 17, Hill Drive, Keppetipola Road,
Badulla
2
118.75
9,537 30.11.2023 L H Lickson
Investment &
Contractor's Method
Bandarawela Branch, 198B, Badulla Road, Bandarawela
1
10.60
7,731 30.11.2023 L H Lickson
Investment &
Contractor's Method
Ettampitiya Branch, 23, Nuwara Eliya Road, Ettampitiya
1
20.35
3,729 30.11.2023 L H Lickson
Investment &
Contractor's Method
Haputale Branch (Browns), 20, Station Road, Haputale
1
158.70
7,361 30.11.2023 L H Lickson
Contractor's Method
Monaragala Branch, Manager Quarters & staff Quarters, 401,
Wellawaya Road, Moneragala
3
320.00
13,011 30.11.2023 L H Lickson
Investment &
Contractor's Method
Siyabalanduwa Branch, Premadasa Hardware Building,
Ampara Junction ,Siyabalanduwa
1
28.00
5,886 30.11.2023 L H Lickson
Investment &
Contractor's Method
Western Province Central
Bambalapitiya Branch, 20, Galle Road, Colombo 04
1
-
7,776 30.11.2023 W A T I P Jayathilake
Investment method
Borella Branch, 71, Denister De Silva Mawatha, Borella
1
49.27
20,173 30.11.2023 K T D Thissera
Investment and
Contractor's method
City Office, 41, Bristtol Lane, Colombo 01
1
39.50
31,443 30.11.2023 W D P Rupananda
Investment and
Contractor's method
Dematagoda Land, 400, Denister De Silva Mawatha, Colombo 09
-
38.14
- 30.11.2023 W D P Rupananda
Comparison Method
Grandpass Branch, 703, Srimavo Bandaranayake Mawatha,
Grandpass
1
20.12
6,210 30.11.2023 A G Gunarathne
Investment and
Contractor's method
Wellawatta Branch, 149/2, Galle Road, Colombo 06
1
51.25
15,832 30.11.2023 A G Gunarathne
Cost Approach
Western Province North
Gampaha Branch, 170,Colombo Road, Gampaha
1
34.06
7,297 30.11.2023 K T D Thissera
Comparison Method
Ganemulla Branch (Land), 156, Kirindiwita Road, Ganemulla
-
43.61
- 30.11.2023 K T D Thissera
Comparison Method
Ja Ela Branch, 19, Negombo Road, Ja-ela
1
45.94
8,618 30.11.2023 W A T I P Jayathilake
Investment &
Contractor's Method
Kadawatha Branch, 469, Ragama Road, Kadawatha
1
30.72
6,138 30.11.2023 W A T I P Jayathilake
Investment &
Contractor's Method
Kiribathgoda Branch (Land), 235, Kandy Road, Kiribathgoda
-
43.70
- 30.11.2023 K T D Thissera
Comparison Method

Name of Premises
Number
of
Buildings
Land
Extent
(Perches)
Building
(Square
feet)
Date of
valuation
Valuer
Basis of Valuation
Carrying value
of Land
Revalued
Amount of Land
Revaluation
Surplus/ (Loss)
of Land
Carrying
value of
Buildings
Revalued
Amount /
Carrying value
of Buildings
Revaluation
Surplus/(Loss)
of Buildings
Total
Revaluation
Surplus/ (Loss)
Total Revalued
Amount /
Carrying Value
LKR '000
LKR '000
LKR '000
LKR '000
LKR '000
LKR '000
LKR '000
LKR '000
Ranna Land, Main street , Ranna
-
40.00
- 30.11.2023 U Rajapaksha
Comparison Method
28,199
36,000
7,801
-
-
-
7,801
36,000
Tangalle Branch, 91/1, 91/2 , Tissa Road , Tangalle
1
21.05
5,370 30.11.2023 U Rajapaksha
Contractor's Method
31,575
42,300
10,725
29,600
44,200
14,600
25,325
86,500
Weeraketiya Branch, Belliatta Road, Weeraketiya
1
36.87
4,480 30.11.2023 U Rajapaksha
Contractor's Method
48,000
66,400
18,400
24,698
36,100
11,402
29,802
102,500
Weligama Branch, 239, Main Street, Weligama
1
97.75
8,394 30.11.2023 U Rajapaksha
Contractor's Method
97,750
203,500
105,750
20,049
40,075
20,026
125,776
243,575
Walasmulla Branch, 28, Beliatta Road , Walasmulla
1
38.00
8,045 30.11.2023 U Rajapaksha
Contractor's Method
57,000
76,000
19,000
55,931
75,600
19,669
38,669
151,600
2,107,334
4,333,160
2,225,826
789,645
1,079,210
289,565
2,515,391
5,412,370
Uva Province
AGMs Quarters UVA Province Office, 1/90 Bandarawela
Road, Badulla
1
220.00
3,836 30.11.2023 L H Lickson
Investment &
Contractor's Method
92,773
98,550
5,777
5,024
6,273
1,249
7,026
104,823
Badulla Uva Pro. Office, 17, Hill Drive, Keppetipola Road,
Badulla
2
118.75
9,537 30.11.2023 L H Lickson
Investment &
Contractor's Method
59,316
61,453
2,137
11,565
22,843
11,278
13,415
84,296
Bandarawela Branch, 198B, Badulla Road, Bandarawela
1
10.60
7,731 30.11.2023 L H Lickson
Investment &
Contractor's Method
82,824
95,200
12,376
19,580
35,397
15,817
28,193
130,597
Ettampitiya Branch, 23, Nuwara Eliya Road, Ettampitiya
1
20.35
3,729 30.11.2023 L H Lickson
Investment &
Contractor's Method
11,123
12,140
1,017
9,831
13,767
3,936
4,953
25,907
Haputale Branch (Browns), 20, Station Road, Haputale
1
158.70
7,361 30.11.2023 L H Lickson
Contractor's Method
39,192
46,740
7,548
9,042
13,250
4,208
11,756
59,990
Monaragala Branch, Manager Quarters & staff Quarters, 401,
Wellawaya Road, Moneragala
3
320.00 13,011 30.11.2023 L H Lickson
Investment &
Contractor's Method
84,800
110,000
25,200
38,672
52,191
13,519
38,719
162,191
Siyabalanduwa Branch, Premadasa Hardware Building,
Ampara Junction ,Siyabalanduwa
1
28.00
5,886 30.11.2023 L H Lickson
Investment &
Contractor's Method
35,000
21,400
(13,600)
13,778
25,600
11,822
(1,778)
47,000
405,028
445,483
40,455
107,492
169,321
61,829
102,284
614,804
Western Province Central
Bambalapitiya Branch, 20, Galle Road, Colombo 04
1
-
7,776 30.11.2023 W A T I P Jayathilake
Investment method
-
-
-
185,980
274,200
88,220
88,220
274,200
Borella Branch, 71, Denister De Silva Mawatha, Borella
1
49.27 20,173 30.11.2023 K T D Thissera
Investment and
Contractor's method
513,200
528,200
15,000
84,843
75,000
(9,843)
5,157
603,200
City Office, 41, Bristtol Lane, Colombo 01
1
39.50 31,443 30.11.2023 W D P Rupananda
Investment and
Contractor's method
610,000
717,500
107,500
365,108
152,500
(212,608)
(105,108)
870,000
Dematagoda Land, 400, Denister De Silva Mawatha, Colombo 09
-
38.14
- 30.11.2023 W D P Rupananda
Comparison Method
273,000
307,750
34,750
-
-
-
34,750
307,750
Grandpass Branch, 703, Srimavo Bandaranayake Mawatha,
Grandpass
1
20.12
6,210 30.11.2023 A G Gunarathne
Investment and
Contractor's method
181,080
241,440
60,360
21,558
30,884
9,326
69,686
272,324
Wellawatta Branch, 149/2, Galle Road, Colombo 06
1
51.25 15,832 30.11.2023 A G Gunarathne
Cost Approach
530,000
545,000
15,000
40,576
54,000
13,424
28,424
599,000
2,107,280
2,339,890
232,610
698,065
586,584
(111,481)
121,129
2,926,474
Western Province North
Gampaha Branch, 170,Colombo Road, Gampaha
1
34.06
7,297 30.11.2023 K T D Thissera
Comparison Method
119,200
170,000
50,800
33,780
55,000
21,220
72,020
225,000
Ganemulla Branch (Land), 156, Kirindiwita Road, Ganemulla
-
43.61
- 30.11.2023 K T D Thissera
Comparison Method
78,500
80,000
1,500
-
-
-
1,500
80,000
Ja Ela Branch, 19, Negombo Road, Ja-ela
1
45.94
8,618 30.11.2023 W A T I P Jayathilake
Investment &
Contractor's Method
165,000
212,000
47,000
264,187
48,000
(216,187)
(169,187)
260,000
Kadawatha Branch, 469, Ragama Road, Kadawatha
1
30.72
6,138 30.11.2023 W A T I P Jayathilake
Investment &
Contractor's Method
120,000
124,300
4,300
19,606
27,700
8,094
12,394
152,000
Kiribathgoda Branch (Land), 235, Kandy Road, Kiribathgoda
-
43.70
- 30.11.2023 K T D Thissera
Comparison Method
327,750
315,900
(11,850)
-
-
-
(11,850)
315,900

Name of Premises
Number
of
Buildings
Land
Extent
(Perches)
Building
(Square
feet)
Date of
valuation
Valuer
Basis of Valuation
Negombo Branch, 118, Rajapakse Broadway, Negombo
1
93.60 15,561 30.11.2023 W A T I P Jayathilake
Investment and
Contractor's Method
Negombo City Branch, 77, Main Street, Negombo
1
10.76
8,355 30.11.2023 W A T I P Jayathilake
Contractor's Method
Pettah Branch, 212/63, Gas Work Street, Colombo 11
1
28.29 25,222 30.11.2023 W D P Rupananda
Investment and
Contractor's Method
Western Province South
Aluthgama Branch, 14, Douglas Gunawardana Mawatha
Aluthgama
1
36.60
6,558 30.11.2023 B K Dayaratne
Contractor's Method
Beruwala Branch, 165A, Galle Road, Beruwala
1
21.50
5,850 30.11.2023 B K Dayaratne
Contractor's Method
Bulathsinhala Branch, 40, Horana Road, Athura, Bulathsinhala
1
55.52
6,900 30.11.2023 B K Dayaratne
Contractor's Method
Dehiwala Branch, 207, Galle Road, Dehiwela
1
22.00
12,454 30.11.2023 A G Gunaratna
Cost Approach
Horana Branch, 87, Anguruwathota Road, Horana
1
70.02
10,345 30.11.2023 B K Dayaratne
Contractor's Method
Idama Branch, 707, Galle Road, Moratuwa
1
61.12
13,411 30.11.2023 A G Gunaratna
Cost Approach
Kalutara Branch, 218, Galle Road, Kalutara South, Kalutara
1
45.86
10,645 30.11.2023 B K Dayaratne
Contractor's Method
Kottawa Branch (Land), 903, Avissawella Road, Kottawa
-
35.22
-
30.11.2023 K T D Thisera
Comparison Method
Maharagama Branch & Central Training Institute, 88,
Highlevel Road, Maharagama
2
185.10
82,121 30.11.2023 A G Gunaratna
Cost and Income
Approach
Matugama Branch, 72, Agalawatte Road, Matugama
1
9.50
4,158 30.11.2023 A G Gunaratna
Cost Approach
Nugegoda Branch, 174, Highlevel Road, Nugegoda,
1
67.73
42,253 30.11.2023 A G Gunaratna
Cost and Income
Approach
Panadura Branch, 21, Susantha Mawatha, Panadura
1
80.00
11,336 30.11.2023 K T D Thisera
Contractor's Method
Panadura City Branch, 17/3D, Jayathilake Mawatha, Panadura
1
36.00
7,764 30.11.2023 K T D Thisera
Cost Approach
Wadduwa Branch, 58 & 56 Station Road, Wadduwa
1
29.00
6,440 30.11.2023 B K Dayaratne
Contractor's Method
Holiday Homes & Rests
Badulla Fernham Bungalow & Property (Land), 153, Spring
Valley Road, Badulla
-
222.25
- 30.11.2023 L H Lickson
Contractor's Method
Bandarawela Holiday Home, Bindunuwewa, Bandarawela
1
115.00
3,500 30.11.2023 L H Lickson
Investment and
Contractor's Method
Dickoya Upper Glencarn Bungalow, Maskeliya Road, Hatton
1
189.65
9,027 30.11.2023 R H Jayawardana
Contractor's Method
Dickoya lower Glencarn Bungalow (Land), Maskeliya Road,
Hatton
-
100.00
- 30.11.2023 R H Jayawardana
Contractor's Method
Haputale Woodland Bungalow, Woodland Bungalow,
Haputale
1
135.00
4,195 30.11.2023 L H Lickson
Investment and
Contractor's Method
Jaffna Bank Rest Holiday Home, 34/3, Rasavinthoddam
Road, Jaffna
1
269.83
9,605 30.11.2023 P P T Mohideen
Market Value
Kandy Holiday Home, 5/1B, Wimaladharma Mawatha,
Dangolla Road, Kandy
1
39.00
3,953 30.11.2023 R A R M N Rajakaruna
Contractor's
Method
Lindula Ridge Holiday Home, Tilliocultry,Talawakale
1
175.00
3,072 30.11.2023 R H Jayawardana
Contractor's Method
Nuwara Eliya Holiday Home, 16, Hill Street, Nuwara Eliya
1
35.27
2,715 30.11.2023 R H Jayawardana
Contractor's Method

Carrying value
of Land
Revalued
Amount of Land
Revaluation
Surplus/ (Loss)
of Land
Carrying
value of
Buildings
Revalued
Amount /
Carrying value
of Buildings
Revaluation
Surplus/(Loss)
of Buildings
Total
Revaluation
Surplus/ (Loss)
Total Revalued
Amount /
Carrying Value
LKR '000
LKR '000
LKR '000
LKR '000
LKR '000
LKR '000
LKR '000
LKR '000
Negombo Branch, 118, Rajapakse Broadway, Negombo
1
93.60 15,561 30.11.2023 W A T I P Jayathilake
Investment and
Contractor's Method
327,600
486,200
158,600
30,561
72,800
42,239
200,839
559,000
48,400
58,000
9,600
48,914
27,000
(21,914)
(12,314)
85,000
539,000
638,000
99,000
50,750
82,000
31,250
130,250
720,000
1,725,450
2,084,400
358,950
447,798
312,500
(135,298)
223,652
2,396,900
80,520
128,100
47,580
22,443
32,854
10,411
57,991
160,954
64,500
86,000
21,500
11,205
14,550
3,345
24,845
100,550
80,790
134,650
53,860
12,831
15,283
2,452
56,312
149,933
Dehiwala Branch, 207, Galle Road, Dehiwela
154,000
165,000
11,000
53,257
66,458
13,201
24,201
231,458
Contractor's Method
260,600
295,000
34,400
29,451
35,000
5,549
39,949
330,000
Idama Branch, 707, Galle Road, Moratuwa
1
61.12 13,411 30.11.2023 A G Gunaratna
Cost Approach
244,480
275,040
30,560
14,447
43,935
29,488
60,048
318,975
Kalutara Branch, 218, Galle Road, Kalutara South, Kalutara
1
45.86 10,645 30.11.2023 B K Dayaratne
Contractor's Method
177,440
221,800
44,360
32,269
35,841
3,572
47,932
257,641
Kottawa Branch (Land), 903, Avissawella Road, Kottawa
-
35.22
- 30.11.2023 K T D Thisera
Comparison Method
281,760
264,000
(17,760)
-
-
-
(17,760)
264,000
Maharagama Branch & Central Training Institute, 88,
Highlevel Road, Maharagama
2
185.10 82,121 30.11.2023 A G Gunaratna
Cost and Income
Approach
658,462
700,000
41,538
186,023
322,000
135,977
177,515
1,022,000
Matugama Branch, 72, Agalawatte Road, Matugama
1
9.50
4,158 30.11.2023 A G Gunaratna
Cost Approach
47,500
57,000
9,500
2,434
4,000
1,566
11,066
61,000
Nugegoda Branch, 174, Highlevel Road, Nugegoda,
1
67.73 42,253 30.11.2023 A G Gunaratna
Cost and Income
Approach
677,300
812,760
135,460
411,951
473,240
61,289
196,749
1,286,000
Panadura Branch, 21, Susantha Mawatha, Panadura
1
80.00 11,336 30.11.2023 K T D Thisera
Contractor's Method
360,000
520,000
160,000
22,916
46,000
23,084
183,084
566,000
Panadura City Branch, 17/3D, Jayathilake Mawatha, Panadura
1
36.00
7,764 30.11.2023 K T D Thisera
Cost Approach
63,000
175,000
112,000
65,496
40,000
(25,496)
86,504
215,000
Wadduwa Branch, 58 & 56 Station Road, Wadduwa
1
29.00
6,440 30.11.2023 B K Dayaratne
Contractor's Method
58,000
116,000
58,000
65,848
68,920
3,072
61,072
184,920
3,208,352
3,950,350
741,998
930,571
1,198,081
267,510
1,009,508
5,148,431
Holiday Homes & Rests
Badulla Fernham Bungalow & Property (Land), 153, Spring
Valley Road, Badulla
-
222.25
- 30.11.2023 L H Lickson
Contractor's Method
22,225
44,450
22,225
-
-
-
22,225
44,450
Bandarawela Holiday Home, Bindunuwewa, Bandarawela
1
115.00
3,500 30.11.2023 L H Lickson
Investment and
Contractor's Method
23,000
28,250
5,250
9,519
9,410
(109)
5,141
37,660
Dickoya Upper Glencarn Bungalow, Maskeliya Road, Hatton
1
189.65
9,027 30.11.2023 R H Jayawardana
Contractor's Method
12,617
16,426
3,809
47,800
67,033
19,233
23,042
83,459
Dickoya lower Glencarn Bungalow (Land), Maskeliya Road,
Hatton
-
100.00
- 30.11.2023 R H Jayawardana
Contractor's Method
15,000
20,000
5,000
-
-
-
5,000
20,000
Haputale Woodland Bungalow, Woodland Bungalow,
Haputale
1
135.00
4,195 30.11.2023 L H Lickson
Investment and
Contractor's Method
21,000
27,000
6,000
6,221
12,378
6,157
12,157
39,378
Jaffna Bank Rest Holiday Home, 34/3, Rasavinthoddam
Road, Jaffna
1
269.83
9,605 30.11.2023 P P T Mohideen
Market Value
121,424
120,000
(1,424)
137,951
70,000
(67,951)
(69,375)
190,000
Kandy Holiday Home, 5/1B, Wimaladharma Mawatha,
Dangolla Road, Kandy
1
39.00
3,953 30.11.2023 R A R M N Rajakaruna Contractor's
Method
31,200
97,500
66,300
15,928
15,928
-
66,300
113,428
Lindula Ridge Holiday Home, Tilliocultry,Talawakale
1
175.00
3,072 30.11.2023 R H Jayawardana
Contractor's Method
8,750
17,500
8,750
9,126
18,000
8,874
17,624
35,500
Nuwara Eliya Holiday Home, 16, Hill Street, Nuwara Eliya
1
35.27
2,715 30.11.2023 R H Jayawardana
Contractor's Method
85,750
92,610
6,860
15,704
17,000
1,296
8,156
109,610

Name of Premises
Number
of
Buildings
Land
Extent
(Perches)
Building
(Square
feet)
Date of
valuation
Valuer
Basis of Valuation
Cey Bank Rest Nuwara Eliya (Phase 1), 19, Hill Street, Nuwara
Eliya
1
67.54
3,335 30.11.2023 R H Jayawardana
Contractor's Method
Negambo Holiday Homes, 118, Rajapakshe Broadway,
Negambo
1
-
2,643 30.11.2023 W A T I P Jayathilake
Investment and
Contractor's Method
Others
Colombo 7 - GM's Bangalow, 75, Ananda Kumaraswamy
Mawatha, Colombo 7
1
79.80
6,380 30.11.2023 A G Gunaratna
Cost Approach
Colombo Darly Rd. Stores Browns Building, 481, T B Jayah
Mawatha, Colombo 10.
1
151.00
26,209 30.11.2023 W D P Rupananda
Contractor's Method
Colombo World Trade Centre, 08, 8-2/1, Bank of Ceylon
Mawatha, Colombo 01
1
-
6,347 30.11.2023 K T D Tissera
Investment Method
Boc Merchant Tower Colpetty - Walker's & Sons,
28 St. Michael's Road, Cololmbo 03
-
57.00
- 30.11.2023 K T D Tissera
Comparison Method
Grand Total

Name of Premises
Number
of
Buildings
Land
Extent
(Perches)
Building
(Square
feet)
Date of
valuation
Valuer
Basis of Valuation
Carrying value
of Land
Revalued
Amount of Land
Revaluation
Surplus/ (Loss)
of Land
Carrying
value of
Buildings
Revalued
Amount /
Carrying value
of Buildings
Revaluation
Surplus/(Loss)
of Buildings
Total
Revaluation
Surplus/ (Loss)
Total Revalued
Amount /
Carrying Value
LKR '000
LKR '000
LKR '000
LKR '000
LKR '000
LKR '000
LKR '000
LKR '000
Cey Bank Rest Nuwara Eliya (Phase 1), 19, Hill Street, Nuwara
Eliya
1
67.54
3,335 30.11.2023 R H Jayawardana
Contractor's Method
168,850
182,358
13,508
17,287
24,980
7,693
21,201
207,338
Negambo Holiday Homes, 118, Rajapakshe Broadway,
Negambo
1
-
2,643 30.11.2023 W A T I P Jayathilake
Investment and
Contractor's Method
-
-
-
15,886
16,000
114
114
16,000
509,816
646,094
136,278
275,422
250,729
(24,693)
111,585
896,823
Others
Colombo 7 - GM's Bangalow, 75, Ananda Kumaraswamy
Mawatha, Colombo 7
1
79.80
6,380 30.11.2023 A G Gunaratna
Cost Approach
1,436,400
1,512,400
76,000
11,200
17,864
6,664
82,664
1,530,264
Colombo Darly Rd. Stores Browns Building, 481, T B Jayah
Mawatha, Colombo 10.
1
151.00 26,209 30.11.2023 W D P Rupananda
Contractor's Method
1,600,000
1,736,000
136,000
32,648
44,000
11,352
147,352
1,780,000
Colombo World Trade Centre, 08, 8-2/1, Bank of Ceylon
Mawatha, Colombo 01
1
-
6,347 30.11.2023 K T D Tissera
Investment Method
-
-
-
366,181
399,900
33,719
33,719
399,900
Boc Merchant Tower Colpetty - Walker's & Sons,
28 St. Michael's Road, Cololmbo 03
-
57.00
- 30.11.2023 K T D Tissera
Comparison Method
600,000
1,140,000
540,000
-
-
-
540,000
1,140,000
3,636,400
4,388,400
752,000
410,029
461,764
51,735
803,735
4,850,164
Grand Total
20,264,953
25,821,192
5,556,239
5,429,170
6,411,916
982,746
6,538,985
32,233,108

35
Right of use assets / leasehold properties
Accounting policy
Initial recognition and measurement
Lessee is required to recognise a right-of-use asset representing its right to use the underlying leased asset and a lease liability
representing its obligation to make lease payments in the Statement of Financial Position.
Lessee measures right-of-use assets similarly to other non-financial assets (such as property, plant and equipment) and lease
liabilities similarly to other financial liabilities. Consequently, a lessee recognises amortisation of the right-of-use asset and
interest on the lease liability
Assets and liabilities arising from a lease are initially measured on a present value basis. The initial lease asset equals the lease
liability in most cases
At lease commencement, a lessee accounts for two elements:
(i) Right-of-use asset: Initially, a right-of-use asset is measured in the amount of the lease liability and initial direct costs. Then
it is adjusted by the lease payments made before or on commencement date, lease incentives received, and any estimate of
dismantling and restoration costs.
(ii) Lease liability: The lease liability is in fact all payments not paid at the commencement date discounted to present value
using the interest rate implicit in the lease or incremental borrowing rate if the implicit rate cannot be determined. These
payments may include fixed payments, variable payments, payments under residual value guarantees, purchase price if
purchase option will be exercised.
Subsequent measurement
After commencement date, lessee needs to adjust both elements recognised initially. Lessee accretes the lease liability to
reflect interest and reduce the liability to reflect lease payments made.
Right-of-use asset
Lessee shall measure the right-of-use asset using a cost model under LKAS 16 - "Property, Plant and Equipment" and to
depreciate the asset over the lease term on a straight-line basis. The resulted depreciation amount is charged to the Profit or
Loss
Lease liability
Lessee shall recognise an interest on the lease liability and the lease payments are recognised as a reduction of the lease
liability. Interest on lease liability is charged to the Profit or Loss.
Lessee shall re-measure the lease liability upon the occurrence of certain events (e.g; change in the lease term, change in
variable rents based on an index or rate), which is generally recognised as an adjustment to the right-of-use asset.
Lessee can apply alternative subsequent measurement bases for the right-of-use asset under certain circumstances in
accordance with LKAS 16 -"Property, Plant and Equipment", and LKAS 40- "Investment Property". Right-of-use assets are
subject to impairment testing under LKAS 36-" Impairment of Assets", too.
It is the Bank's policy to consider the period of the rent agreement in calculating the present value of the right-of-use asset.

Bank
Group
As at 31 December
2023
2022
2023
2022
LKR ‘000
LKR ‘000
LKR ‘000
LKR ‘000
Right of use assets/ leasehold properties
11,366,987
9,310,524
7,520,322
6,461,627
Less: Accumulated amortisation
7,858,369
6,308,219
4,533,618
3,837,327
Net book value of right of use assets/ leasehold
properties
3,508,618
3,002,305
2,986,704
2,624,300
Bank
Group
2023
2022
2023
2022
LKR ‘000
LKR ‘000
LKR ‘000
LKR ‘000
Cost
Balance as at 1 January
9,310,524
7,710,364
6,461,627
5,605,695
Transfers
73,441
-
79,024
-
Additions during the year
2,937,581
1,413,734
1,470,986
661,506
Adjustments
(954,559)
186,426
(491,315)
194,426
Balance as at 31 December
11,366,987
9,310,524
7,520,322
6,461,627
Accumulated amortisation
Balance as at 1 January
6,308,219
4,572,409
3,837,327
2,779,976
Transfers
61,977
-
61,977
-
Amortisation during the year
1,522,030
1,759,054
1,002,250
990,918
Adjustments
(33,857)
(23,244)
(367,936)
66,433
Balance as at 31 December
7,858,369
6,308,219
4,533,618
3,837,327
Net book value as at 31 December
3,508,618
3,002,305
2,986,704
2,624,300
Leasehold properties represent the leasehold interest in the lands held for own use. The value of buildings situated in the leasehold
land is shown seperately under property, plant and equipment. The interest on leasehold land is stated at cost less accumulated
amortisation.
35.1 Lease liability
Carrying amounts of lease liabilities included under "Other liabilities" - (Note 47) and the movement during the year is as follows.
Bank
Group
2023
2022
2023
2022
LKR ‘000
LKR ‘000
LKR ‘000
LKR ‘000
Balance as at 1 January
2,407,189
2,962,878
1,828,636
2,233,145
Additions
2,937,581
1,413,734
1,115,139
520,207
Accretion of interest
751,003
358,362
433,816
328,936
Payments
(2,474,244)
(2,462,165)
(1,589,289)
(1,558,956)
Adjustments
(922,708)
134,380
(138,189)
305,304
Balance as at 31 December
2,698,820
2,407,189
1,650,113
1,828,636

35.1.1 Maturity analysis of lease liability
Bank
Group
As at 31 December
2023
2022
2023
2022
LKR ‘000
LKR ‘000
LKR ‘000
LKR ‘000
Less than 1 year
139,269
646,877
168,355
686,801
1 to 5 years
2,177,818
420,980
1,039,808
321,073
More than 5 years
381,733
1,339,332
441,950
820,762
Total lease liability
2,698,820
2,407,189
1,650,113
1,828,636
35.2 Sensitivity factors used to calculate right of use asset / lease liability
Sensitivity
Sensitivity
effect on right
of use asset
Sensitivity
effect on lease
liability
Sensitivity
effect on profit
before tax
LKR ‘000
LKR ‘000
LKR ‘000
Incremental borrowing rate
+1%
(79,346)
(65,254)
6,053
-1%
83,477
67,830
(6,522)
Lease Term
Increased by 1 year
1,037,512
1,154,275
(60,623)
36
Intangible assets
Accounting policy
Basis of recognition
An intangible asset is recognised if it is probable that the future economic benefits that are attributable to the asset will flow to the
Group and the cost of the asset can be measured reliably. An intangible asset is initially measured at cost.
Intangible assets represent the value of computer application software and licenses, other than software applied to the operating
software system of computers.
Measurement
Intangible assets acquired by the Group are stated at cost less accumulated amortisation and accumulated impairment losses.
Subsequent expenditure incurred on intangible assets is capitalised only when it increases the future economic benefits embodied in
the specific asset to which it relates. All other expenditure is expensed as incurred.
Amortisation and impairment
Amortisation is recognised in the Statement of Profit or Loss on a straight line basis over the estimated useful lives of the intangible
assets, from the date that it is available for use since this most closely reflects the expected pattern of consumption of the future
economic benefits embodied in the asset. The estimated useful life of intangible assets is five years or the best estimate of its useful
economic life whichever is lower. The intangible assets with finite lives are reviewed for impairment whenever there is an indication
for impairment and recognised as expenses in the Statement of Profit or Loss to the extent that they are no longer probable of being
recovered from the expected future benefits. Amortisation methods, useful lives and residual values are reviewed at each reporting
date and adjusted if appropriate.
Derecognition
Intangible assets are derecognised when it reveals that they will not generate economic benefits or circumstances indicate that the
carrying value is impaired.
Gains or losses arising from derecognition of an intangible assets are measured as the difference between the net disposal proceeds
and the carrying amount of the assets and are recognised in Statement of Profit or Loss.
Bank
Group
2023
2022
2023
2022
LKR ‘000
LKR ‘000
LKR ‘000
LKR ‘000
Cost
Balance as at 1 January
5,526,320
4,499,109
6,298,056
5,147,815
Additions during the year
476,639
1,027,211
478,130
1,027,390
Derecognised during the year
-
-
-
-
Disposals
-
-
-
-
Exchange rate and other adjustments
-
-
123,018
122,851
Balance as at 31 December
6,002,959
5,526,320
6,899,204
6,298,056
Accumulated amortisation
Balance as at 1 January
4,166,055
3,533,170
4,786,880
4,007,270
Amortisation during the year
484,475
632,885
525,130
795,627
Disposals
-
-
-
-
Exchange rate and other adjustments
-
-
134,918
(16,017)
Balance as at 31 December
4,650,530
4,166,055
5,446,928
4,786,880
Computer software under development
202,446
82,168
202,446
82,168
Net book value as at 31 December
1,554,875
1,442,433
1,654,722
1,593,344
36.1 Fully amortised intangible assets
The initial cost of fully amortised intangible assets which are still in use are as follows;
Bank
Group
As at 31 December
2023
2022
2023
2022
LKR ‘000
LKR ‘000
LKR ‘000
LKR ‘000
Computer software
3,595,628
3,027,433
3,707,180
3,087,982
Total fully amortised intangible assets
3,595,628
3,027,433
3,707,180
3,087,982
37
Deferred tax assets / (liabilities)
Accounting policy
Deferred tax is recognised in respect of temporary differences between the carrying amounts of assets and liabilities for financial
reporting purposes and the amounts used for taxation purposes. Deferred tax is not recognised for the following temporary
differences:
•
The initial recognition of goodwill
• The initial recognition of assets or liabilities in a transaction that is not a business combination and that affects neither accounting
nor taxable profit or loss
• Differences relating to investments in subsidiaries to the extent that it is probable that they will not reverse in the foreseeable
future

Deferred tax is measured at the tax rates that are expected to be applied to the temporary differences when they reverse based on
the laws that have been enacted or substantively enacted by the reporting date. Deferred tax assets and liabilities are offset if there is
a legally enforceable right to offset current tax liabilities against current tax assets and they relate to income taxes levied by the same
tax authority on the same taxable entity or on different tax entities but they intend to settle current tax liabilities and assets on a net
basis or their tax assets and liabilities will be realised simultaneously.
A deferred tax asset is recognised for unused tax losses, tax credits and deductible temporary differences to the extent that it is
probable that future taxable profits will be available against which they can be utilised. Deferred tax assets are reviewed at each
reporting date and are reduced to the extent that it is no longer probable that the related tax benefit will be realised.
The following table shows deferred tax recorded in the Statement of Financial Position and (charge) / reversal recorded in the
"Income tax expense/ (reversal)" - (Note 18.2).
37.1 Bank
As at 31 December
2023
2022
Deferred tax
assets
Deferred
tax
liabilities
Statement
of
profit or
loss
Other
comprehensive
income/equity
Deferred
tax
assets
Deferred
tax
liabilities
Statement
of profit or
loss
Other
comprehensive
income/
equity
LKR '000
LKR '000
LKR '000
LKR '000
LKR '000
LKR '000
LKR '000
LKR '000
Retirement benefits
7,702,974
-
(329,348)
5,682,082
2,350,240
-
(401,392)
1,464,274
Revaluation of property,
plant and equipment
(9,137,381)
-
102,589
(1,961,601)
(7,278,369)
-
(5,272)
(1,859,253)
Investment in financial
instruments
(1,272,671)
-
-
(256,508)
(1,016,163)
-
-
(726,486)
Temporary difference of
provision for impairment
20,998,637
-
(445,941)
-
21,444,578
-
14,259,491
-
Other temporary differences
211,838
-
134,658
-
77,180
-
693,392
-
Total
18,503,397
-
(538,042)
3,463,973
15,577,466
-
14,546,219
(1,121,465)
37.2 Group
As at 31 December
2023
2022
Deferred tax
assets
Deferred
tax
liabilities
Statement
of
profit or
loss
Other
comprehensive
income/equity
Deferred
tax
assets
Deferred
tax
liabilities
Statement
of profit or
loss
Other
comprehensive
income/
equity
LKR '000
LKR '000
LKR '000
LKR '000
LKR '000
LKR '000
LKR '000
LKR '000
Retirement benefits
7,702,975
7,357
(440,542)
5,705,542
2,350,241
95,091
(350,615)
1,421,714
Revaluation of property, plant
and equipment
(9,137,381)
(2,678,399)
282,969
(2,487,921)
(7,278,369)
(2,332,459)
169,893
(2,422,494)
Investment in financial
instruments
(1,272,670)
-
-
(256,508)
(1,016,162)
-
-
(726,486)
Temporary difference of
provision for impairment
20,998,637
-
(395,619)
-
21,444,578
(50,322)
14,207,758
-
Other temporary differences
302,997
(262,554)
348,721
-
98,253
(406,531)
544,010
-
Total
18,594,558
(2,933,596)
(204,471)
2,961,113
15,598,541
(2,694,221)
14,571,046
(1,727,266)
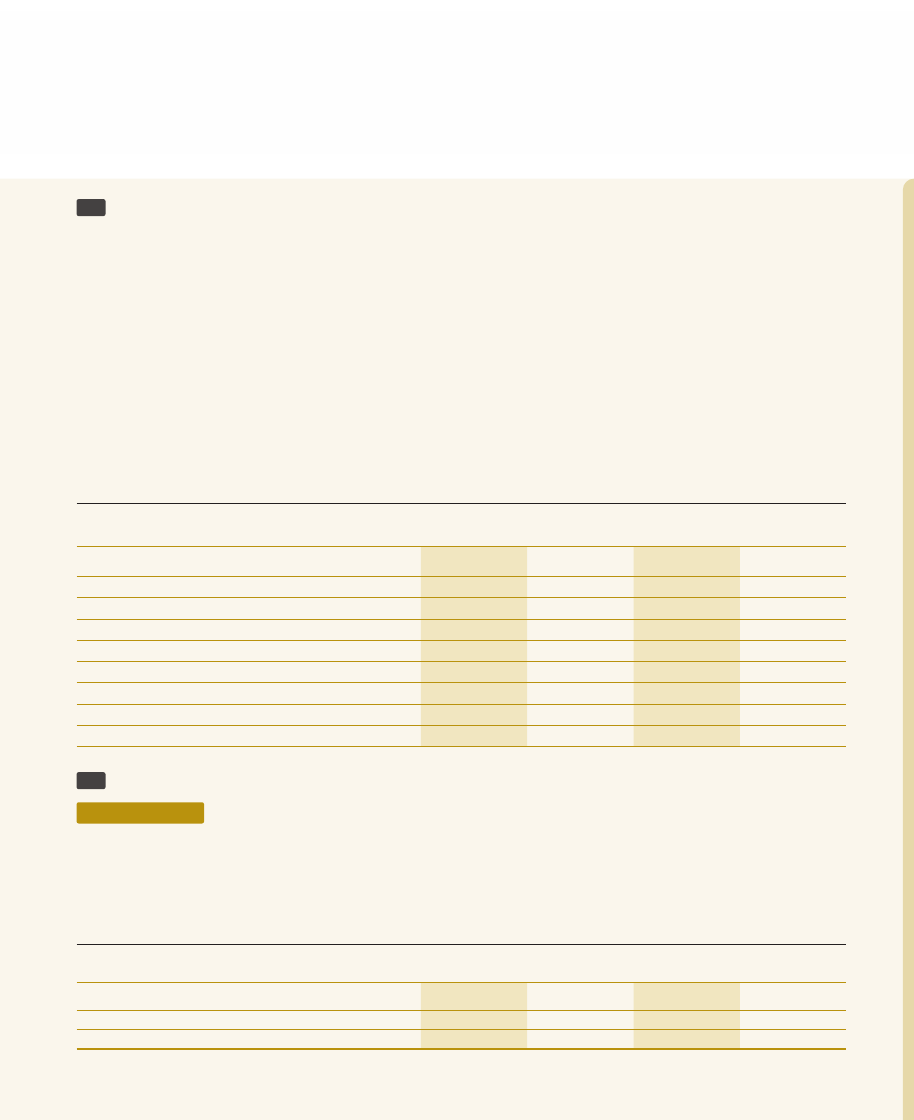
38
Other assets
Pre paid staff cost
Staff loans are initially recognised at fair value according to Sri Lanka Accounting Standard SLFRS 9-" Financial Instruments". The
difference between granted amount and its fair value is treated as pre paid staff cost and amortised over the loan period.
Gold stock in hand
The gold inventory is valued at lower of cost or net realisable value. Cost includes all cost of purchase, cost of conversion and other
costs incurred in bringing the inventory to its present location and condition. Net realisable value is the estimated selling price in the
ordinary course of business less the estimated cost necessary to make the sale.
Employee benefit assets
Employee benefit assets represents net retirement benefit assets of Bank of Ceylon Pension Fund-2014 and Bank of Ceylon
widows’/ widowers’ and orphans’ pension. For more details refer Note 48 - “Employee Retirment Benefit Plans”.
Bank
Group
As at 31 December
Note
2023
2022
2023
2022
LKR ‘000
LKR ‘000
LKR ‘000
LKR ‘000
Consumable stock in hand
1,172,243
927,014
1,235,588
1,023,662
Prepaid staff cost
28,662,256
19,419,943
28,662,256
19,419,943
Cheques in transit - Local
9,302,509
2,467,486
9,302,509
2,467,486
Cheques in transit - Foreign
4,808
7,974
4,808
7,974
Tax recoverable
45
-
-
2,774
17,312
Gold bullion and coins in hand
184,026
237,624
184,026
237,624
Net employee benefit asset
48
18,884,191
20,526,202
18,884,191
20,526,202
Other
54,064,200
52,863,741
54,645,652
53,576,395
Total other assets
112,274,233
96,449,984
112,921,804
97,276,598
39
Due to banks
Accounting policy
Due to banks represents credit balances in Nostro Accounts and short- term borrowings from banks. These are initially recognised at
fair value. Subsequent to initial recognition, these are measured at their amortised cost using the Effective Interest Rate (EIR) method.
Amortised cost is calculated by taking into account any transaction costs that are an integral part of the EIR. The EIR amortisation is
included in “Interest Expenses” - (Note 8.2) in the Statement of Profit or Loss.
Bank
Group
As at 31 December
2023
2022
2023
2022
LKR ‘000
LKR ‘000
LKR ‘000
LKR ‘000
Deposits from other banks
938,301
1,626,196
938,301
1,626,196
Bank overdrafts
2,109,431
9,888,701
2,224,162
9,921,518
Total due to banks
3,047,732
11,514,897
3,162,463
11,547,714
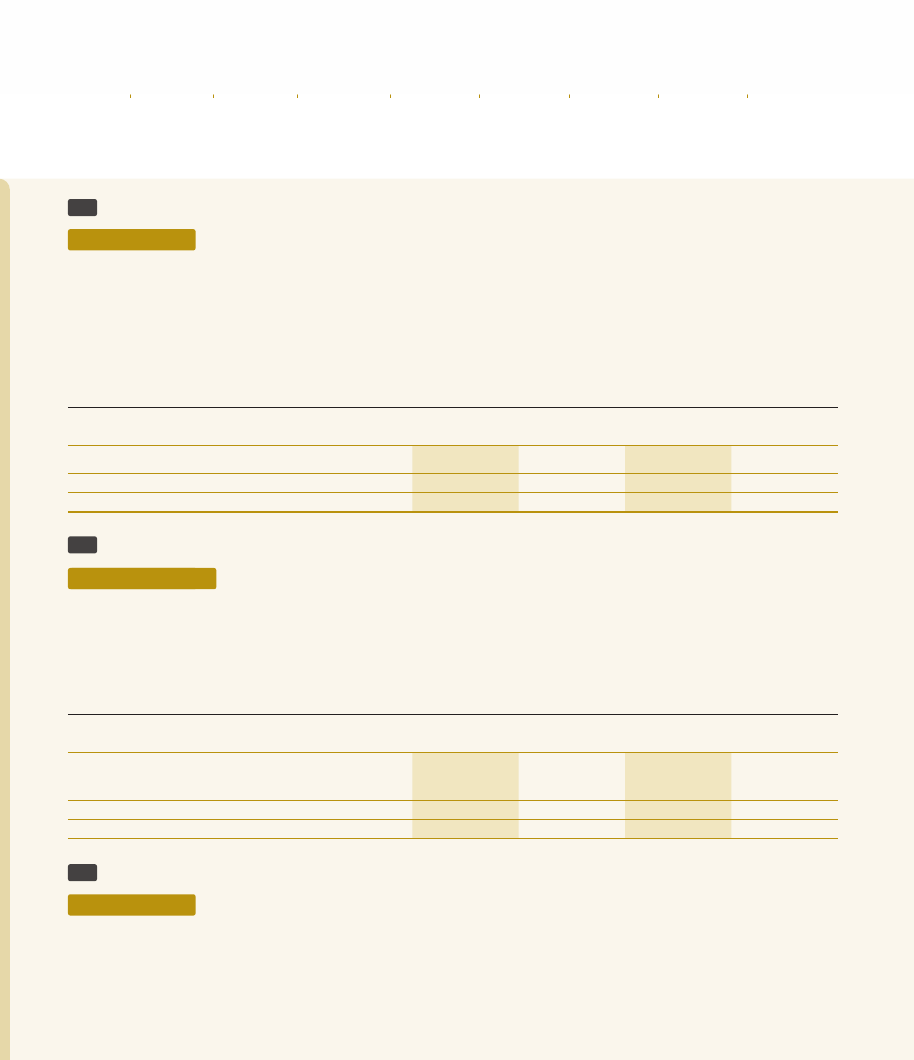
40
Securities sold under repurchase agreements
Accounting policy
Securities sold under repurchase agreements at a specified future date are not derecognised from the Statement of Financial Position
as the Group retains substantially all of the risks and rewards of ownership. The corresponding cash received is recognised in the
Statement of Financial Position as an asset with a corresponding obligation to return it, including accrued interest as a liability within
securities sold under repurchase agreements reflecting the transaction’s economic substance as a borrowing to the Group. The
difference between the sale and repurchase prices is treated as interest expense and is amortised over the life of agreement using
EIR.
Bank
Group
As at 31 December
2023
2022
2023
2022
LKR ‘000
LKR ‘000
LKR ‘000
LKR ‘000
With banks
1,720,373
134,550,201
1,087,073
134,270,402
With customers
76,742,697
45,668,342
76,742,697
45,668,342
Total Securities sold under repurchase agreements
78,463,070
180,218,543
77,829,770
179,938,744
41
Derivative financial instruments
Accounting policy
Derivative financial instruments include contracts which are entered by the Bank that are not designated as hedging instruments in
hedge relationships as per the Sri Lanka Accounting Standard –SLFRS 9 - "Financial Instruments".
Derivatives are recorded at fair value and carried as liabilities when their fair value is negative. Changes in the fair value of derivatives
are included in "Net gains/(losses) from trading" (Note 10) in Statement of Profit or Loss.
Bank
Group
As at 31 December
2023
2022
2023
2022
LKR ‘000
LKR ‘000
LKR ‘000
LKR ‘000
Foreign Currency Derivatives
Forward exchange contracts
79,062
585,333
79,062
585,333
Currency SWAPs
2,090,140
335,700
2,090,140
335,700
Total derivative financial instruments
2,169,202
921,033
2,169,202
921,033
42
Financial liabilities at amortised cost - due to depositors
Accounting policy
Financial liabilities at amortised cost - due to depositors include non-interest-bearing deposits, savings deposits, term deposits,
deposits payable at call and certificate of deposits, which are initially recognised at fair value. Subsequent to initial recognition,
deposits are measured at their amortised cost using the Effective Interest Rate (EIR) method, except where the Group
designates liabilities at fair value through profit or loss. The EIR amortisation is included in “Interest Expenses” (Note 8.2) in the
Statement of Profit or Loss.
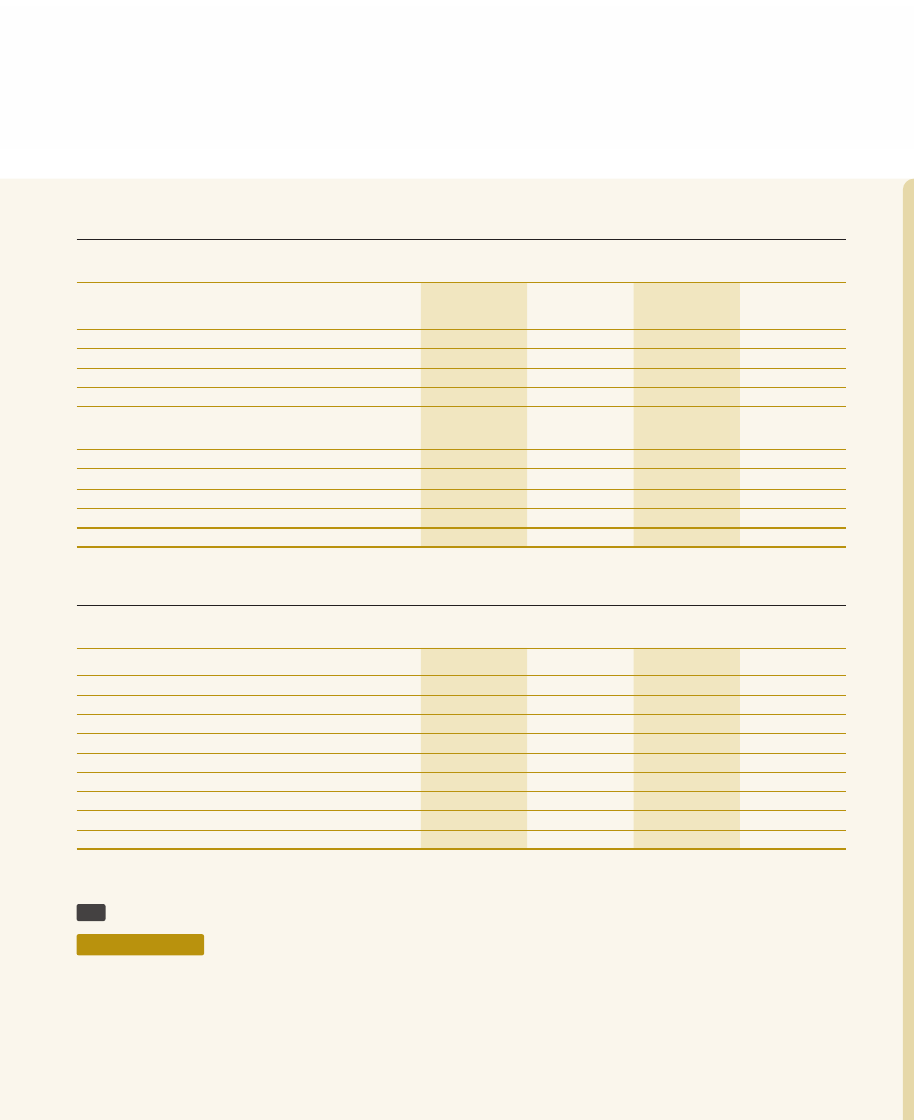
42.1 By product
Bank
Group
As at 31 December
2023
2022
2023
2022
LKR ‘000
LKR ‘000
LKR ‘000
LKR ‘000
Local currency deposits
Demand deposits
180,592,681
174,674,605
180,048,039
174,245,474
Savings deposits
1,034,735,718
558,213,697
1,035,696,345
558,984,668
Time deposits
1,695,628,262
1,558,730,483
1,714,698,285
1,576,815,334
Other deposits
4,035,128
4,785,426
4,042,100
4,785,426
Total local currency deposits
2,914,991,789
2,296,404,211
2,934,484,769
2,314,830,902
Foreign currency deposits
Demand deposits
50,829,782
56,168,342
51,778,862
57,356,149
Savings deposits
174,171,409
189,799,490
174,970,315
190,755,490
Time deposits
738,711,301
786,788,397
744,818,698
789,642,062
Other deposits
3,528,042
5,613,821
3,528,042
5,613,821
Total foreign currency deposits
967,240,534
1,038,370,050
975,095,917
1,043,367,522
Total deposits
3,882,232,323
3,334,774,261
3,909,580,686
3,358,198,424
42.2 By currency
Bank
Group
As at 31 December
2023
2022
2023
2022
LKR ‘000
LKR ‘000
LKR ‘000
LKR ‘000
Sri Lankan Rupee (LKR)
2,914,991,789
2,296,404,211
2,934,484,769
2,314,830,902
United States Dollar (USD)
847,884,778
914,129,417
847,900,906
914,141,915
Great Britain Pound (GBP)
52,998,951
58,144,433
60,810,245
63,096,794
Maldivian Rufiyaa (MVR)
21,677,540
18,382,271
21,677,540
18,382,271
Seychellois Rupee (SCR)
3,323,312
2,611,922
3,323,312
2,611,922
Euro (EUR)
16,257,495
18,344,077
16,266,078
18,362,504
Australian Dollar (AUD)
11,700,572
12,679,056
11,700,572
12,679,056
Indian Rupee (INR)
9,545,387
10,282,833
9,545,387
10,282,833
Other
3,852,499
3,796,041
3,871,877
3,810,227
Total deposits
3,882,232,323
3,334,774,261
3,909,580,686
3,358,198,424
Note : The maturity analysis of deposits is given in Note 60.
43
Financial liabilities at amortised cost - other borrowings
Accounting policy
Financial liabilities at amortised cost - other borrowings represent Standing Lending Facility, Term borrowings from banks in
abroad and Sri Lanka, Term borrowings from other financial institutions in Sri Lanka and refinance borrowings which are initially
recognised at fair value. Subsequent to initial recognition, these borrowings are measured at their amortised cost, using the
Effective Interest Rate (EIR) method. Amortised cost is calculated by taking into account any discount or premium on the
issue and costs that are an integral part of the EIR. The EIR amortisation is included in “Interest Expenses” (Note 8.2) in the
Statement of Profit or Loss.
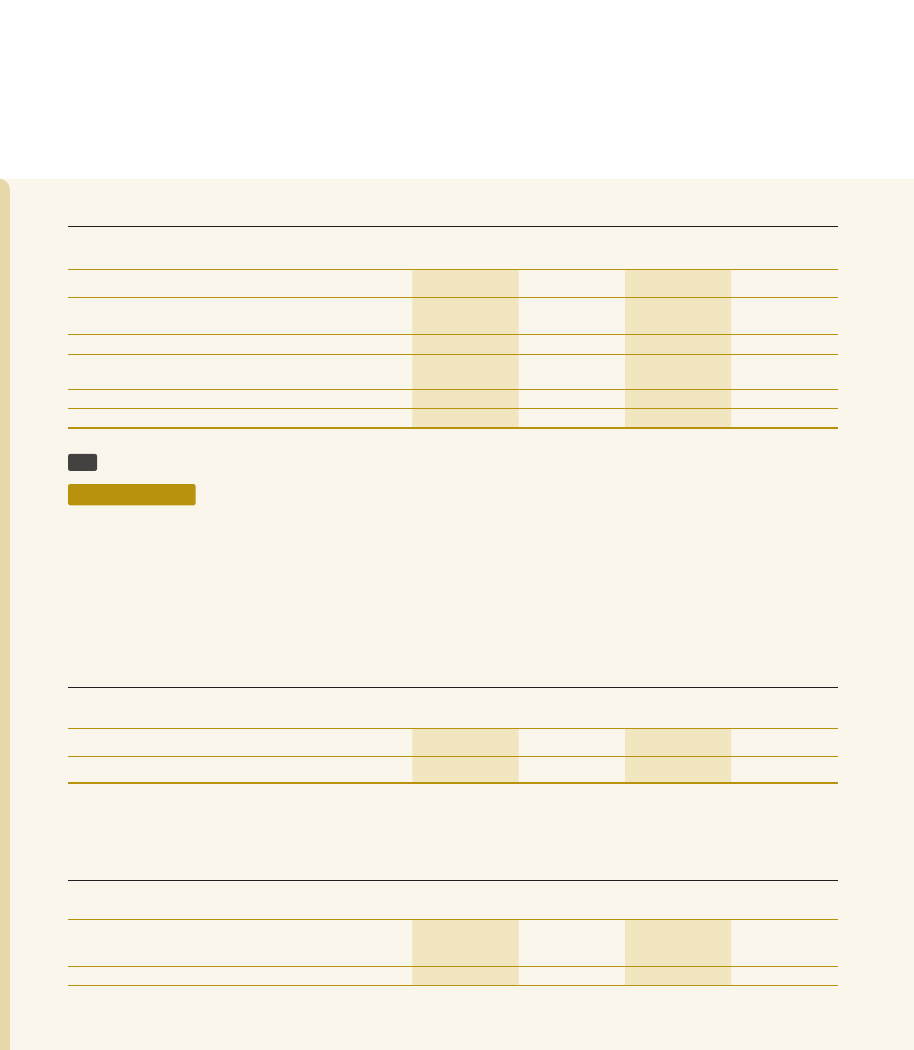
Bank
Group
As at 31 December
2023
2022
2023
2022
LKR ‘000
LKR ‘000
LKR ‘000
LKR ‘000
Standing lending facility
-
294,055,219
-
294,055,219
Call borrowings from banks and other financial institutions
in Sri Lanka
-
-
1,168,008
628,373
Term borrowings from banks abroad
25,989,374
83,925,643
26,557,602
89,670,712
Term borrowings from banks and other financial institutions
in Sri Lanka
-
2,617,349
190,269
2,837,947
Refinance borrowings
7,676,862
9,891,332
7,676,862
9,891,332
Total other borrowings
33,666,236
390,489,543
35,592,741
397,083,583
44
Debt securities issued
Accounting policy
Debt securities issued represent funds borrowed for long-term funding purposes where the substance of the contractual arrangement
results in the Group having an obligation either to deliver cash or another financial asset to the holder, or to satisfy the obligation
other than by the exchange of a fixed amount of cash or another financial asset for a fixed number of own equity shares. Debt
securities are initially recognised at fair value. Subsequent to initial recognition these are measured at their amortised cost using the
Effective Interest Rate (EIR) method. Amortised cost is calculated by taking into account any discount or premium on the issue and
costs that are an integral part of the EIR. The EIR amortisation is included in “Interest Expenses” (Note 8.2) in the Statement of Profit
or Loss.
Bank
Group
As at 31 December
Note
2023
2022
2023
2022
LKR ‘000
LKR ‘000
LKR ‘000
LKR ‘000
Senior debentures
44.1
-
-
730,839
58,807
Total debt securities issued
-
-
730,839
58,807
Note: The maturity analysis of debt securities issued is given in Note 60.
44.1 Senior debentures
Bank
Group
As at 31 December
2023
2022
2023
2022
LKR ‘000
LKR ‘000
LKR ‘000
LKR ‘000
Listed debentures
Unsecured, redeemable debentures of LKR 100 each
-
-
730,839
58,807
Total debt securities issued
-
-
730,839
58,807
44.2 Movement in senior debentures
Bank
Group
2023
2022
2023
2022
LKR ‘000
LKR ‘000
LKR ‘000
LKR ‘000
Balance as at 1 January
-
-
58,807
2,107,182
Issued during the year
-
-
622,830
67,700
Redemptions
-
-
-
(2,107,182)
Amortisation adjustments
-
-
49,202
(8,893)
Balance as at 31 December
-
-
730,839
58,807
44.3 Senior debentures
Bank
Group
Amount as at 31 December Note
Interest
payable
frequency
Issue date
Maturity
date
Coupon rate
2023
2022
2023
2022
2023
2022
%
%
LKR '000
LKR '000
LKR '000
LKR '000
Fixed interest rate
Unsecured, redeemable
debentures
(a)
Annually
16.11.2022
15.11.2027
29.50
24.00
-
-
22,894
24,472
Unsecured, redeemable
debentures
(a)
Semi
annually
16.11.2022
15.11.2027
28.00
23.50
-
-
31,132
34,335
Unsecured, redeemable
debentures
(a)
Annually
10.04.2023
09.04.2028
29.50
-
-
-
315,719
-
Unsecured, redeemable
debentures
(a)
Semi
annually
10.04.2023
09.04.2028
28.00
-
-
-
254,259
-
Unsecured, redeemable
debentures
(a)
At Maturity
10.04.2023
09.04.2028
30.00
-
-
-
106,835
-
Total debt securities issued
-
-
730,839
58,807
Note :
(a) Debentures that are listed in Colombo Stock Exchange.
45
Current tax liabilities
Bank
Group
As at 31 December
2023
2022
2023
2022
LKR ‘000
LKR ‘000
LKR ‘000
LKR ‘000
Balance as at 1 January
6,523,443
647,993
6,836,397
978,532
Current tax expense
13,110,855
13,550,460
13,950,967
13,774,530
Payments during the year
(12,124,580)
(5,500,380)
(12,604,215)
(5,796,331)
Double tax relief and tax credit
(3,091,907)
(2,133,684)
(3,285,976)
(1,961,485)
Prior year and other adjustments
3,203,864
(40,946)
2,977,524
(141,537)
Closing balance at 31 December
7,621,675
6,523,443
7,874,697
6,836,397
Current tax assets
-
-
2,774
17,312
Current tax liabilities
7,621,675
6,523,443
7,877,471
6,853,709
Current tax labilities/ (assets)
7,621,675
6,523,443
7,874,697
6,836,397
46
Insurance contract liabilities
Accounting policy
Life insurance contract liabilities
These liabilities are measured by using the gross premium valuation method as prescribed by the Regulation of Insurance Industry
Act. No 43 of 2000. The liability is determined as the discounted value of the expected contractual cash outflows less the discounted
value of the expected premiums. Valuation assumptions are derived based on the best estimate experience with a prescribed risk
margin to allow for adverse deviations.
At each reporting date, an assessment is made of whether the recognised life insurance liabilities are adequate, by using a liability
adequacy test.
Liability Adequacy Test (LAT)
At each reporting date, an assessment is made of whether the recognised life insurance liabilities are adequate by using an existing
liability adequacy test as laid out under SLFRS 4 - “Insurance Contracts”. The liability value is adjusted to the extent that it is
adequate to meet future benefits and expenses.
Any deficiency is recognised in the Statement of Profit or Loss by setting up a provision for liability adequacy.
Non-life insurance contract liabilities
Non-life insurance contract liabilities are recognised when contracts are entered into and premiums are charged. These liabilities are
known as the outstanding claims provision, which are based on the estimated ultimate cost of all claims incurred but not settled at the
reporting date, whether reported or not, together with related claims handling costs and reduction for the expected value of salvage
and other recoveries. Delays can be experienced in the notification and settlement of certain types of claims, therefore the ultimate
cost of these cannot be known with certainty at the reporting date. The liability is calculated at the reporting date using a range
of standard actuarial claim projection techniques, based on empirical data and current assumptions that may include a margin for
adverse deviation. The liability is not discounted for the time value of money. No provision for equalisation or catastrophe reserves is
recognised. The liabilities are derecognised when the contract expires, is discharged or is cancelled.
Liability Adequacy Test (LAT)
The provision for unearned premiums represents premiums received for risks that have not yet expired. Generally the reserve is
released over the term of the contract and is recognised as premium income. At each reporting date the company reviews its
unexpired risk and a liability adequacy test is performed to determine whether there is any overall excess of expected claims and
deferred acquisition costs over unearned premiums.
This calculation uses current estimates of future contractual cash flows after taking account of the investment return expected to
arise on assets relating to the relevant non-life insurance technical provisions. If these estimates show that the carrying amount
of the unearned premiums (less related deferred acquisition costs) is inadequate, the deficiency is recognised in the statement of
comprehensive income by setting up a provision for liability adequacy.
46.1 Insurance contract liabilities - Life
Group
2023
2022
LKR ‘000
LKR ‘000
Balance as at 1 January
355,190
413,743
Increase / (decrease) in life fund
23,602
(105,016)
Fair value reserve
(18,463)
6,814
Unclaimed benefits
(723)
39,649
Balance as at 31 December
359,606
355,190
46.2 Insurance contract liabilities - Non life
Group
As at 31 December
2023
2022
LKR ‘000
LKR ‘000
Provision for reported claims by policy holders
373,695
363,604
Provision for claims on Incurred But Not Reported (IBNR)
41,497
44,414
Outstanding claims provision
415,192
408,018
Provision for unearned premiums
256,536
254,755
Total insurance contract liabilities - Non life
671,728
662,773
47
Other liabilities
Bank
Group
As at 31 December
Note
2023
2022
2023
2022
LKR ‘000
LKR ‘000
LKR ‘000
LKR ‘000
Cheques sent on clearing
690,217
2,948,898
690,217
2,948,898
Lease creditors
Within 12 months
139,269
646,877
168,355
686,801
Later than 12 months
2,559,551
1,760,312
1,481,758
1,141,835
Net employee benefit liabilities
48
44,560,774
28,360,338
45,018,752
28,716,772
Other
40,191,736
60,359,225
42,476,727
62,930,924
Total other liabilities
88,141,547
94,075,650
89,835,809
96,425,230

48
Employee retirement benefit plans
The Bank has the pension schemes established under an Industrial Award which are solely funded by the Bank. There are Widows’/
Widowers’ and Orphans’ Pension Schemes established by the members.
The assets of these three plans are held independently of the Bank’s assets and administered by Boards of Trustees/ Managers,
representing the management and the employees, as provided in the Trust Deed/ Rules of the respective funds.
These funds are subject to annual audits independent to the audit of the Bank, by a firm/s of Chartered Accountants appointed by
the members and actuarial valuations are carried out as per the rules governing these funds.
Bank
Group
As at 31 December
Note
2023
2022
2023
2022
LKR ‘000
LKR ‘000
LKR ‘000
LKR ‘000
Net employee benefit liabilities
Bank of Ceylon Pension Trust Fund
48.1.3
42,665,507
26,738,169
42,665,507
26,738,169
Provision for terminal gratuity
48.3
792,280
667,703
1,250,258
1,024,137
Provision for encashment of medical leave
48.5
1,102,987
954,466
1,102,987
954,466
Total net employee benefit liabilities
44,560,774
28,360,338
45,018,752
28,716,772
Net employee benefit assets
Bank of Ceylon Widows'/ Widowers' and
Orphans' Pension Fund
48.2.3
9,024,137
10,060,347
9,024,137
10,060,347
Bank of Ceylon Pension Fund-2014
48.4.3
9,860,054
10,465,855
9,860,054
10,465,855
Total net employee benefit assets
18,884,191
20,526,202
18,884,191
20,526,202
48.1 Bank of Ceylon Pension Trust Fund
The ‘Bank of Ceylon Pension Trust Fund’ is a funded, non contributory, defined retirement benefit plan, operated for the
payment of pensions until death of the permanent employees who have completed a minimum of ten years of continuous
service with the Bank, at their retirement on reaching the retirement age on or after 55 years or on medical grounds, before
reaching retirement age. The pension is computed as a percentage of the last drawn salary excluding certain allowances.
Contributions to the Pension Trust Fund are made monthly, based on the advice of a qualified actuary, currently at 56.8%
of gross salary. The Fund is valued by a qualified actuary annually. This fund has been approved by the Government and
administrated independently. The subsidiaries and associate companies of the Group do not have pension funds.
An actuarial valuation of the Pension Trust Fund as at 31 December 2023 was carried out by Messrs Actuarial & Management
Consultant
(Pvt)
Limited.
The valuation has been done using the “Projected Unit Credit Method”, which is recommended in the Sri Lanka Accounting
Standard -LKAS 19 - “Employee Benefits”. The benefit is available to all permanent employees who have joined the Bank prior
to 1 January 1996. The results of the actuarial valuation of the Pension Trust Fund is summarised as follows:

48.1.1 Net benefit expense (recognised under personnel expenses)
Bank / Group
For the year ended 31 December
2023
2022
LKR ‘000
LKR ‘000
Current service cost
83,724
148,893
Net interest expenses
4,812,871
2,365,284
Net benefit expense
4,896,595
2,514,177
48.1.2 Amount recognised in other comprehensive income
Bank / Group
For the year ended 31 December
2023
2022
LKR ‘000
LKR ‘000
Actuarial (gains) / losses on the defined benefit obligation
19,950,025
859,487
Actuarial (gains) / losses on plan assets
(7,767,826)
3,098,205
Net actuarial (gains) / losses recognised in other comprehensive income
12,182,199
3,957,692
48.1.3 Net retirement benefit liability
Bank / Group
As at 31 December
Note
2023
2022
LKR ‘000
LKR ‘000
Fair value of plan assets
48.1.4
51,144,443
44,663,506
Defined benefit obligation
48.1.5
93,809,950
71,401,675
Net retirement benefit liability
42,665,507
26,738,169
48.1.4 Changes in fair value of plan assets
Bank / Group
2023
2022
LKR ‘000
LKR ‘000
Balance as at 1 January
44,663,506
50,384,695
Expected return
8,039,431
5,542,317
Contribution by employer
1,151,456
1,236,285
Benefits paid
(10,477,776)
(9,401,586)
Actuarial gains / (losses) on plan assets
7,767,826
(3,098,205)
Balance as at 31 December
51,144,443
44,663,506

48.1.5 Changes in the present value of the defined benefit obligation
Bank / Group
2023
2022
LKR ‘000
LKR ‘000
Balance as at 1 January
71,401,675
71,887,280
Interest cost
12,852,302
7,907,601
Current service cost
83,724
148,893
Benefits paid
(10,477,776)
(9,401,586)
(Gains)/ losses due to change in assumptions
23,293,538
(22,346,040)
Actuarial (gains)/ losses on obligation
(3,343,513)
23,205,527
Balance as at 31 December
93,809,950
71,401,675
The present value of the Defined Benefit Obligation as of the valuation date with respect to active employees and pensioners
are LKR 3,677.7 million and LKR 90,132.3 million respectively.
48.1.6 Plan assets consist of the following:
Bank / Group
As at 31 December
2023
2022
LKR ‘000
LKR ‘000
Fixed deposits
41,941,651
33,880,775
Treasury bonds
-
3,119,344
Debentures
2,900,525
4,131,592
Investment in shares
5,141,011
2,630,160
Others
1,161,256
901,635
Total plan assets
51,144,443
44,663,506
48.1.7 Actuarial assumptions
Bank / Group
As at 31 December
2023
2022
%
%
Future salary increment rate
10.00 p.a
15.00 p.a
Increase in future Cost of Living Allowance (COLA)
8.00 p.a
8.00 p.a
Increase in pension in payment (Basic)
1.75 p.a
1.75 p.a
Discount rate
13.00 p.a
18.00 p.a
Attrition rate
Nil
Nil
The Bank uses IALM (2006-2008) Ultimate Mortality Table issued by the Institute of Actuaries of India.
NOTES TO THE FINANCIAL STATEMENTS

Increase / decrease in the following assumptions will change the present value of defined benefit obligation as illustrated below;
Bank / Group
0.5% increase
0.5% decrease
LKR ‘000
LKR ‘000
Discount rate
90,818,577
96,987,303
Salary increment
93,843,551
93,776,944
Cost of Living Allowance
96,217,355
91,534,611
Further, the remaining years of benefit payments are expected to be 7.4 years.
The following payments are expected from the Pension Trust Fund in future years.
Bank / Group
As at 31 December
2023
2022
LKR ‘000
LKR ‘000
Within the next 12 months
9,965,676
9,657,728
Between 1 and 5 years
38,297,398
33,257,597
Between 5 and 10 years
23,122,645
16,610,499
Beyond 10 years
22,424,231
11,875,851
Total expected payments
93,809,950
71,401,675
48.2 Bank of Ceylon Widows' / Widowers' and Orphans' Pension Fund
The Bank is liable for and guarantees the payments to the beneficiaries of the "Bank of Ceylon Widows’ / Widowers’ and Orphans’
Pension Fund" to which the Bank’s employees who joined the Bank before 1 January 1996, monthly contribute 8% of their gross
salary. The Bank’s liability towards the beneficiaries of the employees arises when an employee who has contributed to the fund for
five continuous years dies while in service or on the death of a pensioner where the Bank will be liable to pay Widows’ and Orphans’
Pension to his / her beneficiaries monthly. The pension to the beneficiaries of an employee who dies while in service is based on the
last drawn salary excluding certain allowances.
An actuarial valuation of the Widows'/Widowers' and Orphans' Pension Fund as at 31 December 2023 was carried out by Messrs
Actuarial & Management Consultant (Pvt) Limited. Funding would be done in consultation with the Actuary, trustees and beneficiaries.
This fund has been approved by the Government and administered independently.
The valuation has been done using the “Projected Unit Credit Method”, which is recommended in the Sri Lanka Accounting Standard
-LKAS 19 - “Employee Benefits”. The results of the actuarial valuation of the Widows'/Widowers' and Orphans' Pension Fund is
summarised as follows:
48.2.1 Net benefit expense (recognised under personnel expenses)
Bank / Group
For the year ended 31 December
2023
2022
LKR ‘000
LKR ‘000
Current service cost
3,597
8,285
Net interest income
(1,810,862)
(1,328,039)
Net benefit expense / (income)
(1,807,265)
(1,319,754)

48.2.2 Amount recognised in other comprehensive income
Bank / Group
For the year ended 31 December
2023
2022
LKR ‘000
LKR ‘000
Actuarial (gains) / losses on the defined benefit obligation
8,570,729
2,443,015
Actuarial (gains) / losses on plan assets
(5,688,999)
629,318
Actuarial (gains)/losses on actuarial valuation
2,881,730
3,072,333
48.2.3 Retirement benefit assets
Bank / Group
As at 31 December
Note
2023
2022
LKR ‘000
LKR ‘000
Fair value of plan assets
48.2.4
37,901,108
29,011,391
Defined benefit obligation
48.2.5
(28,876,971)
(18,951,044)
Retirement benefit assets
9,024,137
10,060,347
48.2.4 Changes in fair value of plan assets
Bank / Group
2023
2022
LKR ‘000
LKR ‘000
Balance as at 1 January
29,011,391
28,076,481
Expected return
5,222,050
3,172,642
Contribution paid in to plan
38,255
60,366
Benefits paid
(2,059,587)
(1,668,780)
Actuarial gains / (losses) on plan asset
5,688,999
(629,318)
Balance as at 31 December
37,901,108
29,011,391
48.2.5 Changes in the present value of the defined benefit obligation
Bank / Group
2023
2022
LKR ‘000
LKR ‘000
Balance as at 1 January
18,951,044
16,323,921
Interest cost
3,411,188
1,844,603
Current service cost
3,597
8,285
Benefits paid
(2,059,587)
(1,668,780)
Actuarial (gains) / losses on obligation
(452,310)
8,900,020
(Gain)/ losses due to change in assumptions
9,023,039
(6,457,005)
Balance as at 31 December
28,876,971
18,951,044
The present value of the defined benefit obligation as of the valuation date with respect to active employees, pensioners and family
pensioners who are receiving benefits are LKR 236.9 million, LKR 8,836.0 million and LKR 19,804.0 million respectively.

48.2.6 Plan assets consist of the following
Bank / Group
As at 31 December
2023
2022
LKR ‘000
LKR ‘000
Fixed deposits
37,899,905
26,822,116
Debentures
-
2,187,743
Others
1,203
1,532
Total plan assets
37,901,108
29,011,391
48.2.7 Actuarial assumptions
Bank / Group
As at 31 December
2023
2022
%
%
Future salary increment rate
10.00 p.a
15.00 p.a
Increase in future Cost of Living Allowance (COLA)
8.00 p.a
8.00 p.a
Increase in widows' /widowers' and orphans' pension in payment (Basic)
Nil
Nil
Discount rate
13.00 p.a
18.00 p.a
Attrition rate
Nil
Nil
The Bank uses IALM (2006-2008) Ultimate Mortality Table issued by the Institute of Actuaries of India.
Increase / decrease in the following assumptions will have an impact on the present value of defined benefit obligation as illustrated
below;
Bank / Group
0.5% increase
0.5% decrease
LKR ‘000
LKR ‘000
Discount rate
27,672,432
30,173,454
Salary increment
28,877,831
28,876,124
Cost of living allowance
30,079,913
27,754,930
Further, the remaining years of benefit payments are expected to be 9.7 years.
The following payments are expected from the fund in future years.
Bank / Group
As at 31 December
2023
2022
%
%
Within the next 12 months
2,131,329
1,943,567
Between 1 and 5 years
9,187,803
7,441,936
Between 5 and 10 years
6,912,710
4,576,467
Beyond 10 years
10,645,129
4,989,074
Total expected payments
28,876,971
18,951,044

48.3 Provision for terminal gratuity
In compliance with the Payment of Gratuity Act No 12 of 1983 provision is made in the accounts from the first year of service for
gratuity payable to employees who have not completed ten years of service as they are not in pensionable service of the Bank.
Provision has not been made in the Financial Statements for retirement gratuity for the employees who are eligible for the retirement
benefits under the pension schemes in force. However, employees whose services are terminated after five years other than by
retirement are eligible to receive a terminal gratuity under the Payment of Gratuity Act No. 12 of 1983, at the rate of one half of the
basic or consolidated wage or salary, cost of living and all other allowances applicable to the last month of the financial year, for each
year of continuous service
In terms of Sri Lanka Accounting Standard LKAS 19 - "Employee Benefits", the Bank and its subsidiaries have calculated the post-
employment benefit obligations, based on the actuarial valuation method recommended in the standard. The gratuity liabilities are
not externally funded
An actuarial valuation of the Gratuity Fund as at 31 December 2023 was carried out by Messrs Actuarial and Management Consultant
(Pvt) Limited.
The valuation has been done using the “Projected Unit Credit Method”, which is recommended in the Sri Lanka Accounting Standard
-LKAS 19 - “Employee Benefits”.
Bank
Group
2023
2022
2023
2022
LKR ‘000
LKR ‘000
LKR ‘000
LKR ‘000
Balance as at 1 January
667,703
486,334
1,024,137
882,629
Provision charge / (reversal) during the year
173,686
105,253
273,972
180,221
Actuarial (gains) / losses
60,994
136,580
78,302
(47,995)
Payments made during the year
(110,103)
(60,464)
(117,592)
(74,417)
Adjustment / transfers
-
-
(8,561)
83,699
Balance as at 31 December
792,280
667,703
1,250,258
1,024,137
The principal actuarial assumptions used in the valuation were as follows :
Bank / Group
As at 31 December
2023
2022
%
%
Future salary increment rate
10.00 p.a
15.00p.a
Increase in future Cost of Living Allowance (COLA)
8.00 p.a
8.00 p.a
Discount rate
13.00 p.a
18.00 p.a
The Bank uses IALM (2006-2008) Ultimate Mortality Table issued by the Institute of Actuaries of India. Further, the remaining years of
benefit payments are expected to be 11.3 years.
Increase / decrease in the following assumptions will change the present value of defined benefit obligation as illustrated below:
Bank
Group
0.5% increase
0.5% decrease
0.5% increase
0.5% decrease
LKR ‘000
LKR ‘000
LKR ‘000
LKR ‘000
Discount rate
754,146
833,355
1,190,081
1,315,076
Salary increment
819,414
766,932
1,293,077
1,226,038
Cost of living allowance
809,286
776,432
1,277,094
1,225,249

48.4 Bank of Ceylon Pension Fund - 2014
Under the directions of the Ministry of Finance and Planning, this pension scheme was approved by the Board of Directors of the
Bank with effect from 16 December 2014 for the employees recruited to the Bank on or after 1 January 1996. Minimum period of 120
months uninterrupted active service in the Bank at the time of retirement is required to be eligible for any retirement benefit under
this pension scheme. Further, the beneficiaries under this pension scheme will not be entitled for rights and privileges under the
current service gratuity scheme of the Bank except death gratuity payment. Contribution to this pension scheme is made monthly,
based on the advice of a qualified actuary, currently at 12% of gross salary.
An actuarial valuation of this fund as at 31 December 2023 was carried out by Messrs Actuarial & Management Consultant (Pvt)
Limited.
The valuation has been done using the “Projected Unit Credit Method”, which is recommended in the Sri Lanka Accounting Standard
-LKAS 19 - “Employee Benefits”. The results of the actuarial valuation of this Pension Fund is summarised as follows:
48.4.1 Net benefit expense (recognised under personnel expenses)
Bank / Group
For the year ended 31 December
2023
2022
LKR ‘000
LKR ‘000
Current service cost
317,474
717,701
Net interest income
(1,883,854)
(634,620)
Net benefit expense
(1,566,380)
83,081
48.4.2 Amount recognised in other comprehensive income
Bank / Group
For the year ended 31 December
2023
2022
LKR ‘000
LKR ‘000
Actuarial (gains) / losses on the defined benefit obligation
5,691,442
(4,224,874)
Actuarial (gains) / losses on plan assets
(1,859,075)
712,909
Net actuarial (gains) / losses recognised in other comprehensive income
3,832,367
(3,511,965)
48.4.3 Retirement benefit assets
Bank / Group
As at 31 December
Note
2023
2022
LKR ‘000
LKR ‘000
Fair value of plan assets
48.4.4
20,667,766
14,667,395
Defined benefit obligation
48.4.5
(10,807,712)
(4,201,540)
Net retirement benefit assets
9,860,054
10,465,855

48.4.4 Changes in fair value of plan assets
Bank / Group
2023
2022
LKR ‘000
LKR ‘000
Balance as at 1 January
14,667,395
12,512,509
Expected return
2,640,131
1,438,939
Contribution by employer
1,660,186
1,518,540
Benefits paid
(159,021)
(89,684)
Actuarial gains / (losses) on plan asset
1,859,075
(712,909)
Balance as at 31 December
20,667,766
14,667,395
48.4.5 Changes in the present value of the defined benefit obligation
Bank / Group
2023
2022
LKR ‘000
LKR ‘000
Balance as at 1 January
4,201,540
6,994,078
Interest cost
756,277
804,319
Past service cost
-
-
Current service cost
317,474
717,701
Benefits paid
(159,021)
(89,684)
Actuarial (gains) / losses on obligation
(279,673)
945,849
(Gains) / losses due to change in assumptions
5,971,115
(5,170,723)
Balance as at 31 December
10,807,712
4,201,540
The present value of the defined benefit obligation as of the valuation date with respect to active employees and pensioners are LKR
10,652.2 million and LKR 155.5 million respectively.
48.4.6 Plan assets consist of the following
Bank / Group
As at 31 December
2023
2022
LKR ‘000
LKR ‘000
Fixed deposits
19,841,821
13,739,827
Debentures
824,206
916,136
Others
1,739
11,432
Total plan assets
20,667,766
14,667,395

48.4.7 Actuarial assumptions
Bank / Group
As at 31 December
2023
2022
%
%
Future salary increment rate
10.00 p.a*
15.00 p.a
Increase in future Cost of Living Allowance (COLA)
8.00 p.a
8.00 p.a
Increase in pension in payment (Basic)
Nil
Nil
Discount rate
13.00 p.a
18.00 p.a
Attrition rate
Nil
Nil
* For the purpose of the valuation of the fund, the Bank has assumed future salary increment rate of 10% per annum for basic salary.
However, according to the salary increment rates of the pension scheme, all future increment rates are capped at 8% on basic salary.
The Bank uses IALM (2006-08) Ultimate Mortality Table issued by the Institute of Actuaries of India
Increase / decrease in the following assumptions will have an impact on the present value of defined benefit obligation as illustrated
below;
Bank / Group
0.5% increase
0.5% decrease
LKR ‘000
LKR ‘000
Discount rate
9,721,822
11,699,437
Salary increment
11,117,052
10,225,289
Cost of Living Allowance
11,017,098
10,319,203
Further, the remaining years of benefit payments are expected to be 20.7 years.
The following payments are expected from the Pension Fund in future years.
Bank / Group
As at 31 December
2023
2022
LKR ‘000
LKR ‘000
Within the next 12 months
76,946
50,618
Between 1 and 5 years
810,205
520,751
Between 6 and 10 years
1,256,707
727,835
Beyond 10 years
8,663,854
2,902,336
Total expected payments
10,807,712
4,201,540

48.5 Provision for encashment of medical leave
Bank / Group
2023
2022
LKR '000
LKR '000
Balance as at 1 January
954,466
646,064
Provision charge / (reversal) during the year
171,804
73,005
Actuarial (gain) / losses
21,238
250,942
Payments made during the year
(44,521)
(15,545)
Balance as at 31 December
1,102,987
954,466
The principal actuarial assumptions used in the valuation were as follows :
Bank / Group
As at 31 December
2023
2022
%
%
Future salary increment rate
10.00 p.a
15.00 p.a
Increase in future Cost of Living Allowance (COLA)
8.00 p.a
8.00 p.a
Discount rate
13.00 p.a
18.00 p.a
The Bank uses IALM (2006-2008) Ultimate Mortality Table issued by the Institute of Actuaries of India. Further, the remaining year of
benefit payments are expected to be 17.1 years.
Increase / decrease in the following assumptions will change the present value of defined benefit obligation as illustrated below:
Bank / Group
0.5% increase
0.5% decrease
LKR '000
LKR '000
Discount rate
1,023,341
1,190,835
Salary increment
1,162,040
1,049,140
The following payments are expected from the Provision for encashment of medical leave in future years.
Bank / Group
As at 31 December
2023
2022
LKR '000
LKR '000
Within the next 12 months
33,965
39,678
Between 1 and 5 years
135,359
132,361
Between 6 and 10 years
118,513
107,164
Beyond 10 years
815,150
675,263
Total expected payments
1,102,987
954,466
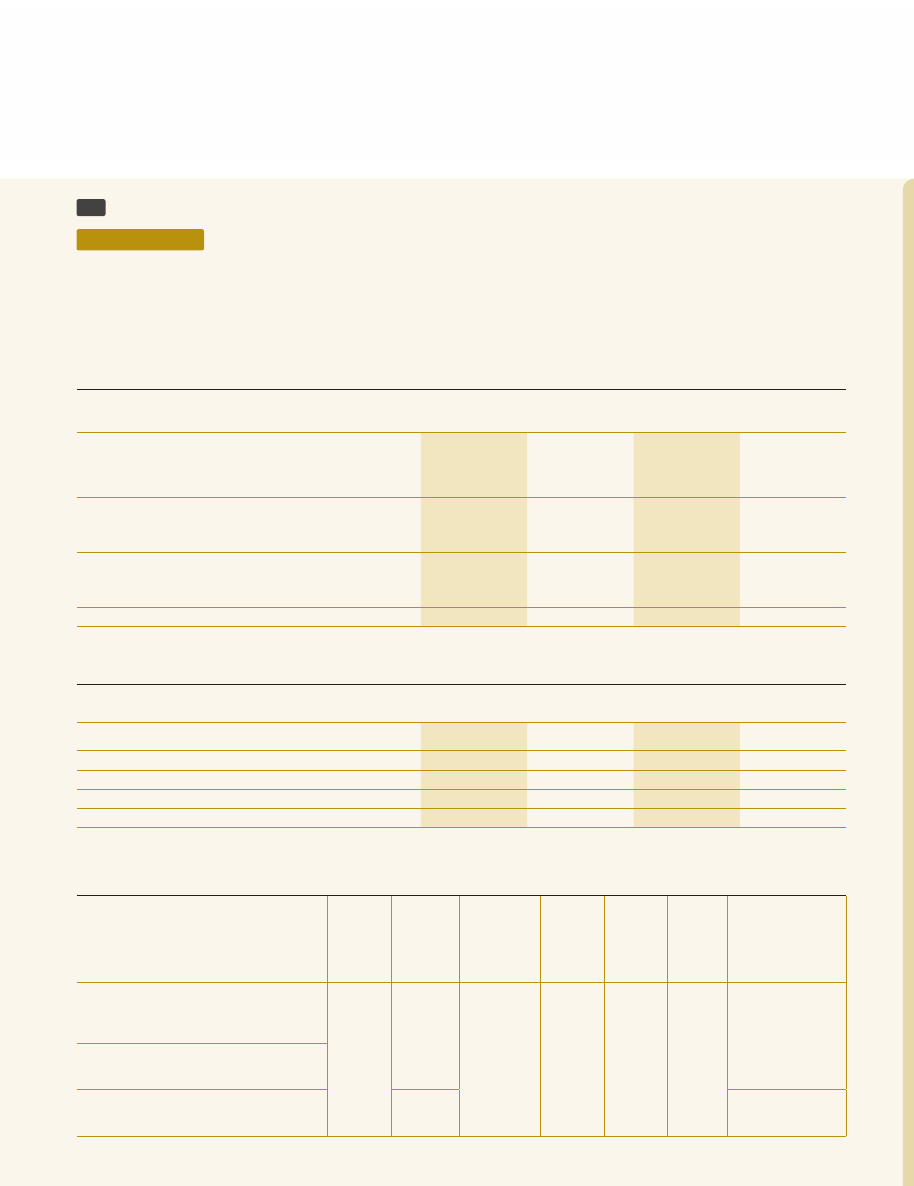
49
Subordinated liabilities
Accounting policy
Subordinated liabilities include funds borrowed for long term funding purposes which are subordinated to other claims. These are
initially recognised at fair value. Subsequent to initial recognition, subordinated liabilities are measured at their amortised cost, using
the Effective Interest Rate (EIR) method. Amortised cost is calculated by taking into account any discount or premium on the issue and
costs that are an integral part of the EIR. The EIR amortisation is included in “Interest Expenses” (Note 8.2) in the Statement of Profit
or Loss.
Bank
Group
As at 31 December
2023
2022
2023
2022
LKR ‘000
LKR ‘000
LKR ‘000
LKR ‘000
Listed debentures
Unsecured, subordinated, redeemable debentures of
LKR 100 each
10,020,013
5,038,775
10,020,013
5,038,775
Unlisted debentures
Unsecured, subordinated, redeemable debentures of
LKR 100 each (private placement)
35,608,086
39,169,530
35,608,086
39,169,530
Additional Tier I capital bond
Unsecured, subordinated, perpetual capital bonds of
LKR 100 each (private placement)
19,063,711
19,549,886
18,809,221
19,290,294
Total subordinated term debts
64,691,810
63,758,191
64,437,320
63,498,599
49.1 The movement in subordinated liabilities
Bank
Group
2023
2022
2023
2022
LKR ‘000
LKR ‘000
LKR ‘000
LKR ‘000
Balance as at 1 January
63,758,191
64,358,855
63,498,599
64,105,970
Issued during the year*
10,000,000
6,490,000
10,000,000
6,490,000
Redemptions during the year
(10,385,589)
(8,103,950)
(10,385,589)
(8,103,950)
Amortisation adjustments
1,319,208
1,013,286
1,324,310
1,006,579
Balance as at 31 December
64,691,810
63,758,191
64,437,320
63,498,599
*As stated in the prospectus, the following table indicates utilisation of funds raised through the debenture issued during the year
and the funds raised will not be used for Related Party Transactions.
Objective
number
Objective as per Prospectus
Amount
allocated
as per
Prospectus
in LKR
Proposed
date of
utiliation
as per
Prospectus
Amount
allocated from
proceeds in
LKR
(A)
% of total
proceeds
Amounts
utilized in
LKR
(B)
% of
utiliation
against
allocation
(B/A)
Clarification if not
fully utilized including
where the funds are
invested (eg : whether
lent to related
party/s etc…)
1
To increase the Tier II capital of the
Bank in order to enhance the Capital
Adequacy Ratio (CAR) and single
borrower limit.
10 Billion
27.12.2023
10 Billion
100
10 Billion
100
Not Appilicable
2
To minimize and manage the gap
exposure in the Bank's assets/ liability
portfolios.
3
To strengthen the Bank's liquidity
position and to increase the asset
base / loan book.
on or before
27.12.2024
Funds will be
utilised on or before
27.12.2024
Total subordinated term debts
49.1 The movement in subordinated liabilities
Bank
Group
49.2 Type of debentures
Bank
Group
Notes
Interest
payable
frequency
Issue date
Maturity
date
Coupon rate
2023
%
2022
%
2023
LKR '000
2022
LKR '000
2023
LKR '000
2022
LKR '000
Fixed interest rate
Listed, Unsecured,
subordinated, redeemable
debentures
(a)
Annually
25.10.2013 24.10.2023
-
13.75
-
1,637,668
-
1,637,668
Listed, Unsecured,
subordinated, redeemable
debentures
(a)
Annually
06.10.2015 05.10.2023
-
9.50
-
1,205,521
-
1,205,521
Listed, Unsecured,
subordinated, redeemable
debentures
(a)
Annually
29.12.2016 28.12.2024
12.75
12.75
784
784
784
784
Unlisted, Unsecured,
subordinated, redeemable
debentures
Annually
29.12.2017 28.12.2025
12.75
12.75
5,003,247
5,004,820
5,003,247
5,004,820
Unlisted, Unsecured,
subordinated, redeemable
debentures
Annually
31.07.2018 30.07.2026
12.00
12.00
7,027,303
7,027,089
7,027,303
7,027,089
Unlisted, Unsecured,
subordinated, redeemable
debentures
Annually
03.12.2018 02.12.2023
-
12.00
-
5,347,618
-
5,347,618
Unlisted, Unsecured,
subordinated, redeemable
debentures
Annually
27.06.2019 26.06.2024
11.75
11.75
3,176,622
3,176,634
3,176,622
3,176,634
Unlisted, Unsecured,
subordinated, redeemable
debentures
Annually
17.07.2019 16.07.2024
11.80
11.80
1,104,087
1,104,092
1,104,087
1,104,092
Unlisted, Unsecured,
subordinated, redeemable
debentures
Annually
18.07.2019 17.07.2024
11.80
11.80
2,315,154
2,315,164
2,315,154
2,315,164
Unlisted, Unsecured,
subordinated, redeemable
debentures
Annually
23.07.2019 22.07.2024
11.80
11.80
2,626,148
2,626,346
2,626,148
2,626,346
Unlisted, Unsecured,
subordinated, redeemable
debentures
Annually
24.07.2019 23.07.2024
11.50
11.50
419,669
419,670
419,669
419,670
Unlisted, Unsecured,
subordinated, redeemable
debentures
Annually
26.07.2019 25.07.2027
11.75
11.75
64,171
64,174
64,171
64,174
Unlisted, Unsecured,
subordinated, redeemable
debentures
Annually
30.12.2022 29.12.2027
29.00
29.00
8,375,369
6,494,529
8,375,369
6,494,529
Listed, Unsecured,
subordinated, redeemable
debentures
With non viability written
down featuers
(a)
Annually
27.12.2023 27.12.2028
15.00
-
10,019,209
-
10,019,209
-
Total fixed interest rate
subordinated debentures
40,131,763
36,424,109
40,131,763
36,424,109
Floating interest rate
Bank
Group
Notes
Interest
payable
frequency
Issue date
Maturity
date
Coupon rate
2023
%
2022
%
2023
LKR '000
2022
LKR '000
2023
LKR '000
2022
LKR '000
Listed, Unsecured,
subordinated, redeemable
debentures (6 months TB
rate (Gross) plus 125 basis
points)
(a)/(b)
Semi
annually
06.10.2015 05.10.2023
-
31.84
-
2,194,782
-
2,194,782
Listed, Unsecured,
subordinated, redeemable
debentures (6 months TB
rate (Gross) plus 125 basis
points)
(a)/(b)
Semi
annually
29.12.2016 28.12.2024
15.41
33.51
20
20
20
20
Unlisted, Unsecured,
subordinated, redeemable
debentures (6 months TB
rate (Gross) plus 250 basis
points with a floor rate of
9.0%)
(b)
Semi
annually
22.11.2021 22.11.2026
17.25
35.01
5,496,316
5,589,394
5,496,316
5,589,394
Total floating interest
rate subordinated
debentures
5,496,336
7,784,196
5,496,336
7,784,196
Additional Tier I capital
bond
Unlisted, Unsecured,
subordinated, perpetual
capital bond (12 months
TB (net) rate plus 150 basis
points with a Floor rate of
9.5%)
Annually
06.07.2020 N/A
15.36
25.34
5,360,837
5,583,891
5,360,837
5,583,891
Unlisted, Unsecured,
subordinated, perpetual
capital bond (Weighted
average 12 months TB
(net) rate plus 150 basis
points with a Floor rate of
9.00%)
Annually
01.12.2020 N/A
14.39
30.96
10,111,114
10,224,787
10,111,114
10,224,787
Unlisted, Unsecured,
subordinated, perpetual
capital bond (Weighted
average 12 months TB
(Net) rate plus 150 basis
points with a Floor rate
of 9%)
Annually
06.07.2021 N/A
15.36
25.34
3,591,760
3,741,208
3,337,270
3,481,616
Total Additional Tier I
capital bonds
19,063,711
19,549,886
18,809,221
19,290,294
Total subordinated
debentures
64,691,810
63,758,191
64,437,320
63,498,599
Notes :
a) Debentures that are listed in the Colombo Stock Exchange.
b) Weighted average 6 months Treasury Bill interest rate at the primary quotations as announced by the Central Bank of Sri Lanka, at the preceding
week of the interest resetting date.
50
Share capital
50.1 Ordinary shares
Bank
Group
2023
2022
2023
2022
LKR ‘000
LKR ‘000
LKR ‘000
LKR ‘000
Authorised
50,000,000 ordinary shares
50,000,000
50,000,000
50,000,000
50,000,000
Issued and fully paid
Balance as at 1 January [25,000,000 odinary shares]
25,000,000
25,000,000
25,000,000
25,000,000
Share issued during the year
-
-
-
-
Balance as at 31 December [25,000,000 ordinary shares]
25,000,000
25,000,000
25,000,000
25,000,000
Capital pending allotment *
Balance as at 1 January
730,000
-
730,000
-
Capital infusion during the year
-
730,000
-
730,000
Balance as at 31 December
25,730,000
25,730,000
25,730,000
25,730,000
*
Capital
pending
allotment
Bank received LKR 730 million from the Government of Sri Lanka during the year 2022. This amount has been reported under capital
pending allotment as of 31 December 2023.
50.2 Net assets value per share
Bank
Group
As at 31 December
2023
2022
2023
2022
LKR ‘000
LKR ‘000
LKR ‘000
LKR ‘000
Amount used as the numerator
Total equity attributable to equity holder of the Bank (LKR '000)
251,714,720
254,184,143
271,457,990
271,473,567
Number of ordinary shares used as denominator
Total number of ordinary shares issued
25,000,000
25,000,000
25,000,000
25,000,000
Net asset value per ordinary share (LKR)
10,068.59
10,167.37
10,858.32
10,858.94
51
Permanent reserve fund
Bank
Group
2023
2022
2023
2022
LKR ‘000
LKR ‘000
LKR ‘000
LKR ‘000
Balance as at 1 January
15,131,000
14,491,000
15,131,000
14,491,000
Transfers during the year
534,000
640,000
534,000
640,000
Balance as at 31 December
15,665,000
15,131,000
15,665,000
15,131,000
The permanent reserve fund is maintained as required by Bank of Ceylon Ordinance (Chapter 397) whereby the Bank must, out of net
profit after taxation, but before any dividend is declared, transfer to a reserve, a sum equivalent to not less than 20% of such profit,
until the reserve is equivalent to 50% of the issued and paid-up capital and thereafter, an appropriate amount determined at 2% per
annum in terms of section 20(1) and (2) of the Banking Act No. 30 of 1988 until the reserve is equal to the paid-up capital.
In order to meet the requirement, an amount of LKR 534.0 million was transferred to the permanent reserve during the year 2023.
(2022 - LKR 640.0 million).
The balance in the permanent reserve fund will be used only for the purposes specified in the Section 20 (2) of the Banking Act No.
30 of 1988.
52
Retained earnings
Bank
Group
2023
2022
2023
2022
LKR ‘000
LKR ‘000
LKR ‘000
LKR ‘000
Balance as at 1 January
158,616,238
136,739,177
159,819,481
138,104,222
Total comprehensive income for the year
13,435,335
29,591,465
14,260,934
29,597,605
Transfers to other reserves
(534,000)
(640,000)
(851,149)
(640,000)
Transfers from other reserves
-
10,548
-
10,548
Surcharge tax
-
(6,738,542)
-
(7,042,422)
Disposal of subsidiaries
-
-
-
-
Reversal of unclaimed dividend
-
-
-
1,427
Revaluation adjustment
7,241
-
7,241
-
Change of non controlling interest
-
-
-
134,511
Dividend
(173,205)
(346,410)
(173,205)
(346,410)
Balance as at 31 December
171,351,609
158,616,238
173,063,302
159,819,481
53
Cash flow hedge reserve
Accounting policy
The Bank has entered in to ten USD/LKR funding SWAPs with the Central Bank of Sri Lanka (CBSL) amounting to USD 90 million
against the borrowing from foreign Bank during the months of April and June 2021 in order to mitigate the foreign exchange risk
and volatility to the profit and loss arising from the USD borrowing. This SWAP agreement has been accounted as per the Hedge
Accounting after the testing of Hedge Effectiveness.
Bank
Group
2023
2022
2023
2022
LKR ‘000
LKR ‘000
LKR ‘000
LKR ‘000
Balance as at 1 January
25,620,635
3,239,266
25,620,635
3,239,266
Net gains / (losses) on cash flow hedge instruments
(20,369,118)
22,381,369
(20,369,118)
22,381,369
Balance as at 31 December
5,251,517
25,620,635
5,251,517
25,620,635
54
Other reserves
Bank
Group
As at 31 December
Note
2023
2022
2023
2022
LKR ‘000
LKR ‘000
LKR ‘000
LKR ‘000
Revaluation reserve
54.1
22,227,386
17,315,482
33,687,424
27,558,103
Free reserve
54.2
169,067
169,067
366,644
366,644
Exchange translation reserve
54.3
8,762,834
10,740,397
12,335,352
14,304,404
Fair value through OCI reserve
54.4
2,557,307
861,324
4,999,807
2,584,356
Statutory reserve - other
54.5
-
-
358,944
358,944
Total other reserves
33,716,594
29,086,270
51,748,171
45,172,451
54.1 Revaluation reserve
Bank
Group
2023
2022
2023
2022
LKR ‘000
LKR ‘000
LKR ‘000
LKR ‘000
Balance as at 1 January
17,315,482
17,356,542
27,558,103
26,302,644
Change in revaluation surplus/ (deficit)
6,880,746
1,818,193
8,635,144
3,695,662
Deferred tax effect on above Revaluation adjustment
(1,961,601)
(1,859,253)
(2,487,921)
(2,422,494)
Revaluation surplus of disposed property
(7,241)
-
(7,241)
-
Transferred to non-controlling interest
-
-
(10,661)
(17,709)
Balance as at 31 December
22,227,386
17,315,482
33,687,424
27,558,103
The revaluation reserve represents the surpluses arising on the revaluation of freehold lands and buildings and buildings on leasehold
lands as at the date of revaluation.
According to the Basel III regulatory directives, issued by the Central Bank of Sri Lanka, the Bank can consider the revaluation surplus
as supplimentary capital in computing capital adequacy ratio, once in every three years.
54.2 Free reserve
Bank
Group
2023
2022
2023
2022
LKR ‘000
LKR ‘000
LKR ‘000
LKR ‘000
Balance as at 1 January
169,067
169,067
366,644
366,644
Balance as at 31 December
169,067
169,067
366,644
366,644
Free reserve has been created for unforeseeable risks and future losses.

54.3 Exchange translation reserve
Bank
Group
2023
2022
2023
2022
LKR ‘000
LKR ‘000
LKR ‘000
LKR ‘000
Balance as at 1 January
10,740,397
3,176,353
14,304,404
4,461,200
Exchange differences on translation of foreign operations
(1,977,563)
7,564,044
(2,286,201)
9,843,204
Transfers to other reserves
-
-
317,149
-
Balance as at 31 December
8,762,834
10,740,397
12,335,352
14,304,404
This represents the exchange differences arising from translating investments made in the capital and net exchange movement arising
on the translation of net equity of Bank of Ceylon (UK) Limited and foreign branches and also exchange differences arising from
translation of the results of foreign branches for this year from the average rate to the exchange rate ruling at the year end.
54.4 Fair value through OCI reserve
Bank
Group
2023
2022
2023
2022
LKR ‘000
LKR ‘000
LKR ‘000
LKR ‘000
Balance as at 1 January
861,324
588,427
2,584,356
1,483,412
Net gains/ (losses) on investments in debt instruments measured at
FVTOCI
165,673
1,328,890
272,685
1,312,732
Net (gains)/ losses on investments in financial assets at FVTOCI
reclassification to profit or loss
-
(5,631)
-
(5,631)
Deferred tax effect on above
(148,518)
(140,185)
(148,518)
(140,185)
Change in fair value on investments in equity instruments
measured at FVTOCI
1,786,818
(313,328)
2,412,486
547,780
Deferred tax effect on above
(107,990)
(586,301)
(107,990)
(586,301)
Transferred to other reseved
-
(10,548)
-
-
Transferred to non-controlling interest
-
-
(13,212)
(27,451)
Balance as at 31 December
2,557,307
861,324
4,999,807
2,584,356
54.5 Statutory reserve - other
Bank
Group
2023
2022
2023
2022
LKR ‘000
LKR ‘000
LKR ‘000
LKR ‘000
Balance as at 1 January
-
-
358,944
358,944
Transfers
-
-
-
-
Balance as at 31 December
-
-
358,944
358,944
55
Non controlling interest
Group
As at 31 December
2023
2022
LKR ‘000
LKR ‘000
Property Development Limited
66,693
117,640
Merchant Bank of Sri Lanka and Finance PLC
647,660
632,109
MBSL Insurance Company Limited
406,472
307,232
Hotels Colombo (1963) Limited
(29)
(14)
Total non-controlling interest
1,120,796
1,056,967
56
Notes to the statement of cash flows
56.1 Change in operating assets
Bank
Group
For the year ended 31 December
2023
2022
2023
2022
LKR ‘000
LKR ‘000
LKR ‘000
LKR ‘000
Change in deposits with regulatory authorities
35,561,890
3,627,252
35,561,890
3,627,252
Change in loans and advances to customers
178,641,032
(284,936,169)
177,603,411
(282,735,630)
Net (increase)/ decrease of financial assets measured at fair value
through profit or loss
(28,584,267)
(995,720)
(34,379,618)
(1,078,270)
Net (increase)/ decrease in securities purchased under resale
agreements and placements with Banks
(60,738,383)
(10,907,815)
(57,445,337)
(10,956,000)
Net (increase)/ decrease in derivative financial instruments
36,629,646
(52,812,955)
36,629,646
(52,812,955)
Change in other operating assets
(30,937,022)
(46,632,822)
(31,857,699)
(45,897,858)
Total
130,572,896
(392,658,229)
126,112,293
(389,853,461)
56.2 Change in operating liabilities
Bank
Group
For the year ended 31 December
2023
2022
2023
2022
LKR ‘000
LKR ‘000
LKR ‘000
LKR ‘000
Net Increase/ (decrease) in deposits from banks
(687,895)
(451,701)
(687,895)
(451,701)
Net Increase/ (decrease) in deposits from customers
532,580,379
408,649,429
536,504,579
412,730,508
Net increase/ (decrease) in securities sold under repurchase
agreements
(101,755,473)
18,062,130
(102,108,974)
18,270,409
Net increase/ (decrease) in short term borrowings
(287,704,308)
3,322,897
(289,374,247)
3,022,842
Net increase/ (decrease) in derivative financial instruments
1,248,169
540,705
1,248,169
540,705
Change in other operating liabilities
(37,470,328)
79,957,246
(36,857,029)
82,933,004
Total
106,210,544
510,080,706
108,724,603
517,045,767
56.3 Other non cash items included in profit before tax
Bank
Group
For the year ended 31 December
2023
2022
2023
2022
LKR ‘000
LKR ‘000
LKR ‘000
LKR ‘000
Gains/ (losses) on revaluation of foreign exchange
7,231,150
15,450,104
7,231,150
15,450,104
Expenses recognised for defined benefit plans
1,868,440
1,455,762
1,982,003
1,539,682
Impairment charges
(4,906,277)
87,155,696
(5,048,666)
87,294,905
Depreciation of investment property
-
-
9,190
2,906
Depreciation of property, plant and equipment
1,846,426
1,894,960
2,692,672
2,717,917
Amortisation of intangible assets and leasehold properties
2,006,505
2,391,939
1,527,380
1,786,545
Accrual for expenses and other non cash items
7,555,811
(3,157,948)
7,548,717
(3,060,353)
Total
15,602,055
105,190,513
15,942,446
105,731,706
57
Contingent liabilities and commitments
Accounting policy
Contingent liabilities are possible obligations whose existence will be confirmed only by uncertain future events or present
obligations where the transfer of economic benefit is not probable or cannot be readily measured as defined in the Sri Lanka
Accounting Standard – LKAS 37 - "Provisions, Contingent Liabilities and Contingent Assets".
In the normal course of business, the Bank undertakes commitments and incurs contingent liabilities with legal recourse to its
customers to accommodate the financial and investment needs of clients, to conduct trading activities and to manage its own
exposure to risk. These consist of financial guarantees, letters of credit and other undrawn commitments to lend. Letters of credit and
guarantees (including standby letters of credit) commit the Bank to make payments on behalf of customers in the event of a specific
act, generally related to the import or export of goods. Guarantees and standby letters of credit carry a similar credit risk to loans.
Operating lease commitments of the Bank (as a lessor and as a lessee) and pending legal claims against the Bank also form part of
commitments of the Bank
Contingent liabilities are not recognised in the Statement of Financial Position but are disclosed unless they are remote. These
financial instruments generate interest or fees and carries elements of credit risk in excess of those amounts recognised as assets and
liabilities in the Statement of Financial Position. However, no material losses are anticipated as a result of these transactions.
These commitments and contingencies are quantified below :
Bank
Group
As at 31 December
Note
2023
2022
2023
2022
LKR ‘000
LKR ‘000
LKR ‘000
LKR ‘000
Contingent liabilities
57.1
915,815,065
647,175,115
924,939,454
648,450,696
Undrawn and undisbursed facilities
57.2
602,718,487
677,788,996
602,718,487
677,789,012
Capital commitments
57.3
14,916,641
13,733,168
15,012,022
13,769,157
Lease commitments
57.4
5,756,036
6,202,490
6,222,148
6,911,191
Total contingent liabilities and commitments
1,539,206,229
1,344,899,769
1,548,892,111
1,346,920,056

57.1 Contingent liabilities
Bank
Group
As at 31 December
Note
2023
2022
2023
2022
LKR ‘000
LKR ‘000
LKR ‘000
LKR ‘000
Acceptances and documentary credit
168,992,212
157,948,135
169,000,251
158,455,999
Bills for collection
58,195,110
64,815,618
58,195,110
64,815,618
Forward exchange contracts
393,201,966
199,453,327
401,621,939
199,453,327
Guarantees
164,216,780
167,974,583
164,389,473
168,133,083
Other commitments
57.1.1
131,208,997
56,983,452
131,732,681
57,592,669
Total contingent liabilities
915,815,065
647,175,115
924,939,454
648,450,696
57.1.1 Other commitments
Bank
Group
As at 31 December
2023
2022
2023
2022
LKR ‘000
LKR ‘000
LKR ‘000
LKR ‘000
Sale commitment of securities for secondary market
3,930,048
-
3,930,048
-
Purchase commitment of securities for secondary market
22,398,423
-
22,398,423
-
Purchase commitment of securities for primary market
-
-
-
-
Forward exchange contract with financial institutions
400,736
170,721
400,736
170,721
Currency swaps
104,479,790
56,812,731
104,479,790
56,812,731
Other commitments
-
-
523,684
609,217
Total other commitments
131,208,997
56,983,452
131,732,681
57,592,669
57.2 Undrawn and undisbursed facilities
Bank
Group
As at 31 December
2023
2022
2023
2022
LKR ‘000
LKR ‘000
LKR ‘000
LKR ‘000
Undisbursed amount of loans
61,045,949
63,053,702
61,045,949
63,053,718
Undrawn limits of overdrafts
163,738,287
129,604,869
163,738,287
129,604,869
Undrawn limits of credit cards
15,159,796
13,062,690
15,159,796
13,062,690
Undrawn limits of letters of credit
132,329,092
127,511,260
132,329,092
127,511,260
Undrawn limits of letters of guarantee
230,445,363
344,556,475
230,445,363
344,556,475
Total undrawn and undisbursed facilities
602,718,487
677,788,996
602,718,487
677,789,012

57.3 Capital commitments
Capital expenditure approved by the Directors, for which, no provision has been made in the Financial Statements, amounts to;
57.3.1 Capital commitments in relation to property, plant and equipment
Bank
Group
As at 31 December
2023
2022
2023
2022
LKR ‘000
LKR ‘000
LKR ‘000
LKR ‘000
Approved and contracted for
4,652,143
2,607,283
4,671,412
2,640,280
Approved and not contracted for
4,755,335
8,819,943
4,831,447
8,819,943
Total capital commitments in relation to property, plant and equipment
9,407,478
11,427,226
9,502,859
11,460,223
57.3.2 Capital commitments in relation to intangible assets
Bank
Group
As at 31 December
2023
2022
2023
2022
LKR ‘000
LKR ‘000
LKR ‘000
LKR ‘000
Approved and contracted for
1,012,663
1,055,942
1,012,663
1,056,199
Approved and not contracted for
4,496,500
1,250,000
4,496,500
1,252,735
Total capital commitments in relation to intangilbe assets
5,509,163
2,305,942
5,509,163
2,308,934
Total capital commitments
14,916,641
13,733,168
15,012,022
13,769,157
57.4 Lease commitments
57.4.1 Operating lease commitments
Future minimum lease payments under non-cancellable operating leases, where the Bank is the lessee, are as follows;
Bank
Group
As at 31 December
2023
2022
2023
2022
LKR ‘000
LKR ‘000
LKR ‘000
LKR ‘000
Not later than 1 year
1,874,352
1,671,640
2,072,162
1,883,558
Later than 1 year and not later than 5 years
2,656,971
3,289,387
2,920,058
3,753,412
Later than 5 years
1,224,713
1,241,463
1,229,928
1,273,156
Total operating lease commitments
5,756,036
6,202,490
6,222,148
6,910,126
Note:
With the implementation of SLFRS 16 - “Leases” effect from 1 January 2019, the operating lease commitments recognised as lease
liability and reported under Other Liabilities (Note 47).
57.4.2
Finance
lease
commitments
Future minimum lease payments under non-cancellable finance leases, where the Bank is the lessee, are as follows;
Bank
Group
As at 31 December
2023
2022
2023
2022
LKR ‘000
LKR ‘000
LKR ‘000
LKR ‘000
Not later than 1 year
-
-
-
1,065
Later than 1 year and not later than 5 years
-
-
-
-
Total finance lease commitments
-
-
-
1,065
57.4.3 Total lease commitments
Bank
Group
As at 31 December
2023
2022
2023
2022
LKR ‘000
LKR ‘000
LKR ‘000
LKR ‘000
Operating lease commitments
5,756,036
6,202,490
6,222,148
6,910,126
Financing lease commitments
-
-
-
1,065
Total lease commitments
5,756,036
6,202,490
6,222,148
6,911,191
57.5 Litigation
Litigations are anticipated in the context of business operations due to the nature of the transactions involved. The Bank and the
Group's companies are involved in various such legal actions and the controls have been established to deal with such legal claims.
There are pending litigations existing as at the end of the reporting period against the Bank, resulting through normal business
operations.
As of 31 December 2023, claims for the Legal Actions against the Bank approximately amount to LKR 6,353.0 million
(2022: LKR 6,647.6 million) , nevertheless the Bank has no impact over such claims whatsoever affecting to the business, operations
or image of the Bank.
58
Assets pledged as security
The securities sold under repurchase agreement by the Bank and the Group and details of assets pledged by the Bank and the
Group, to secure those liabilities are given below;
Bank
Group
As at 31 December
2023
2022
2023
2022
LKR ‘000
LKR ‘000
LKR ‘000
LKR ‘000
Borrowings
Securities sold under repurchase agreements
78,463,070
180,218,543
77,829,770
179,938,744
78,463,070
180,218,543
77,829,770
179,938,744
Secured by ;
Treasury bills
-
-
-
-
Treasury bonds
84,157,764
183,322,972
83,524,464
183,043,173
Total assets pledged as securities
84,157,764
183,322,972
83,524,464
183,043,173
59
Events after the reporting date
Events after the reporting period are those events, favourable and unfavourable, that occur between the reporting date and the date
the Financial Statements are authorised for issue.
There are no events occurring after the reporting date which require adjustments to or disclosure in the Financial Statements.
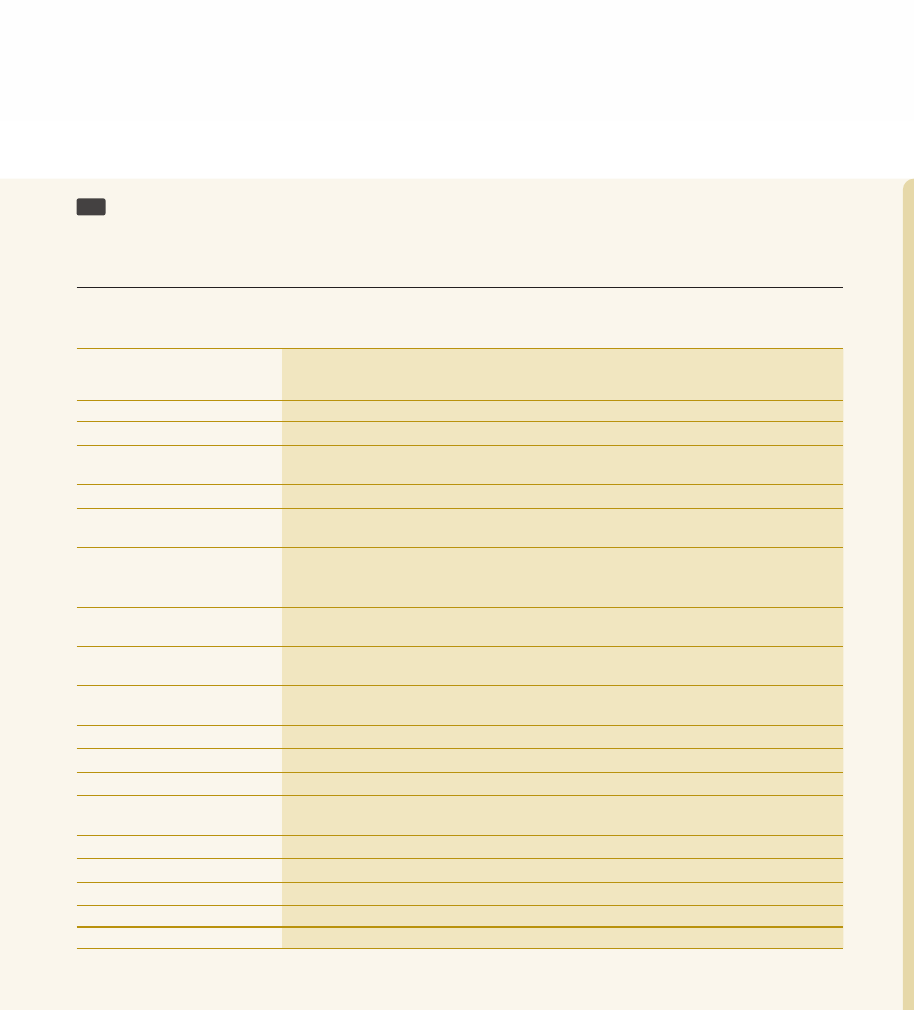
60
Maturity analysis of assets and liabilities
The analysis of total assets and liabilities of the Bank and the Group into relevant maturity groupings based on the remaining
period as at 31 December 2023 in to the contractual maturity date, is given in the table below.
Bank
Group
As at 31 December 2023
Within
12 months
After
12 months
Total
Within
12 months
After
12 months
Total
LKR ‘000
LKR ‘000
LKR ‘000
LKR ‘000
LKR ‘000
LKR ‘000
Assets
Cash and cash equivalents
135,550,505
-
135,550,505
137,369,158
-
137,369,158
Balances with Central Banks
34,932,639
-
34,932,639
34,932,639
-
34,932,639
Placements with banks
74,966,171
-
74,966,171
73,024,979
-
73,024,979
Securities purchased under resale
agreements
3,711,918
-
3,711,918
3,695,392
-
3,695,392
Derivative financial instruments
5,855,581
14,670,259
20,525,840
5,855,581
14,670,259
20,525,840
Financial assets measured at fair
value through profit or loss
36,207,188
4,435,342
40,642,530
36,537,884
12,292,987
48,830,871
Financial assets measured at
amortised cost - loans and
advances
1,360,335,997
848,725,927
2,209,061,924
1,369,606,898
871,004,330
2,240,611,228
Financial assets measured at
amortised cost - debt instruments
666,034,396
987,694,007
1,653,728,403
670,919,863
989,093,115
1,660,012,978
Financial assets measured at fair
value through OCI
30,537,539
18,996,459
49,533,998
30,537,539
21,662,146
52,199,685
Investment in subsidiary
companies
-
8,181,138
8,181,138
-
-
-
Investment in associate companies
-
92,988
92,988
-
737,115
737,115
Investment properties
-
2,414,640
2,414,640
-
95,446
95,446
Property, plant and equipment
-
42,564,498
42,564,498
-
59,566,898
59,566,898
Right of use assets/ leasehold
properties
111,362
3,397,256
3,508,618
214,334
2,772,370
2,986,704
Intangible assets
-
1,554,875
1,554,875
-
1,654,722
1,654,722
Deferred tax assets
-
18,503,397
18,503,397
-
18,594,558
18,594,558
Other assets
93,390,042
18,884,191
112,274,233
93,783,609
19,138,195
112,921,804
Total assets
2,441,633,338
1,970,114,977
4,411,748,315
2,456,477,876
2,011,282,141
4,467,760,017
Percentage (%)
55.3%
44.7%
100%
55.0%
45.0%
100%
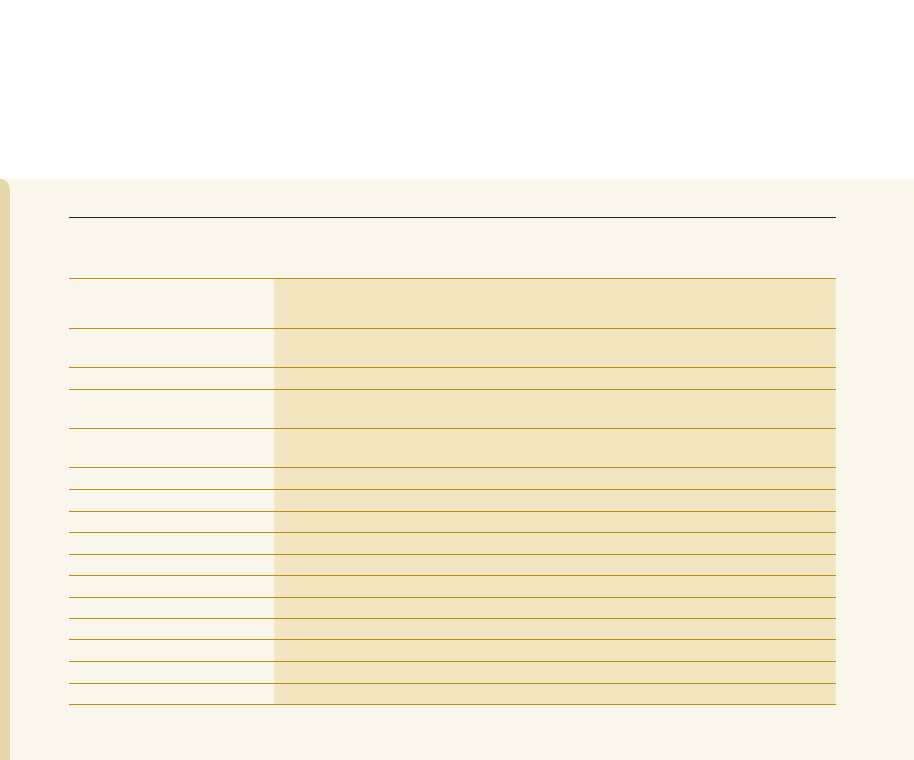
Bank
Group
As at 31 December 2023
Within
12 months
After
12 months
Total
Within
12 months
After
12 months
Total
LKR ‘000
LKR ‘000
LKR ‘000
LKR ‘000
LKR ‘000
LKR ‘000
Liabilities
Due to banks
3,047,732
-
3,047,732
3,162,463
-
3,162,463
Securities sold under repurchase
agreements
78,463,070
-
78,463,070
77,829,770
-
77,829,770
Derivative financial instruments
2,169,202
-
2,169,202
2,169,202
-
2,169,202
Financial liabilities at amortised
cost - due to depositors
3,629,182,015
253,050,308
3,882,232,323
3,646,212,827
263,367,859
3,909,580,686
Financial liabilities at amortised
cost - other borrowings
7,676,862
25,989,374
33,666,236
20,969,560
14,623,181
35,592,741
Debt securities issued
-
-
-
-
730,839
730,839
Current tax liabilities
7,621,675
-
7,621,675
7,877,471
-
7,877,471
Deferred tax liabilities
-
-
-
-
2,933,596
2,933,596
Insurance contract liabilities - Life
-
-
-
-
359,606
359,606
Insurance contract liabilities - Non-life
-
-
-
-
671,728
671,728
Other liabilities
41,021,221
47,120,326
88,141,547
41,911,549
47,924,260
89,835,809
Subordinated liabilities
9,642,484
55,049,326
64,691,810
9,642,484
54,794,836
64,437,320
Equity
-
251,714,720
251,714,720
-
272,578,786
272,578,786
Total liabilities and equity
3,778,824,261
632,924,054
4,411,748,315
3,809,775,326
657,984,691
4,467,760,017
Percentage (%)
85.7%
14.3%
100%
85.3%
14.7%
100%
Net gap
(1,337,190,923)
1,337,190,923
-
(1,353,297,450)
1,353,297,450

The analysis of total assets and liabilities of the Bank and the Group into relevant maturity groupings based on the remaining period
as at 31 December 2022 in to the contractual maturity date, is given in the table below.
Bank
Group
As at 31 December 2022
Within
12 months
After
12 months
Total
Within
12 months
After
12 months
Total
LKR ‘000
LKR ‘000
LKR ‘000
LKR ‘000
LKR ‘000
LKR ‘000
Assets
Cash and cash equivalents
128,401,532
-
128,401,532
135,230,827
-
135,230,827
Balances with Central Banks
70,494,529
-
70,494,529
70,494,529
-
70,494,529
Placements with banks
16,459,303
-
16,459,303
17,811,665
-
17,811,665
Securities purchased under resale
agreements
1,480,403
-
1,480,403
1,463,368
-
1,463,368
Derivative financial instruments
2,354,301
54,801,185
57,155,486
2,357,346
54,798,140
57,155,486
Financial assets measured at fair
value through profit or loss
5,796,380
4,483,675
10,280,055
6,090,227
4,545,963
10,636,190
Financial assets measured at
amortised cost - loans and advances
Financial assets measured at
amortised cost - debt instruments
amortised cost - loans and advances
1,418,124,482
907,469,847
2,325,594,329
1,428,132,909
927,845,424
2,355,978,333
444,213,035
1,111,684,272
1,555,897,307
520,032,061
1,042,341,618
1,562,373,679
Financial assets measured at fair
value through OCI
2,368,652
6,322,150
8,690,802
2,368,651
8,381,393
10,750,044
Investment in subsidiary companies
-
8,181,138
8,181,138
-
-
-
Investment in associate companies
-
92,988
92,988
-
684,536
684,536
Investment properties
-
2,414,640
2,414,640
-
104,798
104,798
Property, plant and equipment
-
34,845,004
34,845,004
-
50,992,323
50,992,323
Right of use assets/ leasehold
properties
894,848
2,107,457
3,002,305
194,821
2,429,479
2,624,300
Intangible assets
-
1,442,433
1,442,433
-
1,593,344
1,593,344
Deferred tax assets
-
15,577,466
15,577,466
-
15,598,541
15,598,541
Other assets
75,923,782
20,526,202
96,449,984
76,490,325
20,786,273
97,276,598
Total assets
2,166,511,247
2,169,948,457
4,336,459,704
2,260,666,729
2,130,701,832
4,390,768,561
Percentage (%)
50.0%
50.0%
100.0%
51.5%
48.5%
100.0%

Bank
Group
As at 31 December 2022
Within
12 months
After
12 months
Total
Within
12 months
After
12 months
Total
LKR ‘000
LKR ‘000
LKR ‘000
LKR ‘000
LKR ‘000
LKR ‘000
Liabilities
Due to banks
11,514,897
-
11,514,897
11,547,714
-
11,547,714
Securities sold under repurchase
agreements
180,218,543
-
180,218,543
179,938,744
-
179,938,744
Derivative financial instruments
921,033
-
921,033
921,033
-
921,033
Financial liabilities at amortised
cost - due to depositors
3,086,759,489
248,014,772
3,334,774,261
3,098,350,368
259,848,056
3,358,198,424
Financial liabilities at amortised
cost - other borrowings
332,292,621
58,196,922
390,489,543
334,881,382
62,202,201
397,083,583
Debt securities issued
-
-
-
-
58,807
58,807
Current tax liabilities
6,523,443
-
6,523,443
6,853,709
-
6,853,709
Deferred tax liabilities
-
-
-
-
2,694,221
2,694,221
Insurance contract liabilities - Life
-
-
-
-
355,190
355,190
Insurance contract liabilities - Non-life
-
-
-
-
662,773
662,773
Other liabilities
63,955,000
30,120,650
94,075,650
65,892,546
30,532,684
96,425,230
Subordinated liabilities
10,385,589
53,372,602
63,758,191
10,375,997
53,122,602
63,498,599
Equity
-
254,184,143
254,184,143
-
272,530,534
272,530,534
Total liabilities and equity
3,692,570,615
643,889,089
4,336,459,704
3,708,761,493
682,007,068
4,390,768,561
Percentage (%)
85.2%
14.8%
100.0%
84.5%
15.5%
100.0%
Net gap
(1,526,059,368)
1,526,059,368
-
(1,448,094,764)
1,448,094,764
-
61
Related party disclosures
Accounting policy
The Bank has entered into transactions with the parties who are defined as related parties in Sri Lanka Accounting Standard - LKAS
24 -" Related Party Disclosures". i.e. significant investors, Subsidiary and Associate companies, post employment benefit plans for
the Bank's employees, Key Management Personnel (KMP), Close Family Members (CFMs) of KMP and other related entities. Those
transactions include lending activities, acceptance and placements, off-balance sheet transactions and provision of other banking and
financial services that are carried out in the ordinary course of business on an arm's length basis at commercial rates, except for the
transactions that KMP have availed under schemes uniformly applicable to all the staff at concessionary rates.
61.1 Parent and the ultimate controlling party
Bank of Ceylon is a Government owned bank.

61.2 Key Management Personnel (KMP) and their Close Family Members (CFMs)
61.2.1 Compensation to Key Management Personnel (KMP) and their Close Family Members (CFMs)
As per the Sri Lanka Accounting Standard -LKAS 24 - "Related Party Disclosures", the KMP include those who are having authority
and responsibility for planning, directing and controlling the activities of the Bank. Accordingly, the Board of Directors and selected
key members of the Corporate Management are identified as KMP who meet the above criteria.
CFMs are defined as family members who may be expected to influence or be influenced by, that KMP in their dealings with the
entity, i.e. spouse, children under 18 years of age and dependants of KMP. Dependant is defined as anyone who depends on the
respective KMP for more than 50% of his or her financial needs.
Compensation to KMP of the Bank
Bank
Group
For the year ended 31 December
2023
2022
2023
2022
LKR ‘000
LKR ‘000
LKR ‘000
LKR ‘000
Short term employment benefits
22,312
28,022
23,364
28,640
Post employment benefits
7,657
7,694
7,657
7,694
Total
29,969
35,716
31,021
36,334
In addition to the above, the Bank / Group has also provided non cash benefits to the KMP in line with the approved benefit plans of
the Bank / Group.
61.2.2 Transactions, arrangements and agreements involving Key Management Personnel (KMP) and their Close Family
Members
(CFMs).
(a) Items in statement of profit or loss
KMP and CFMs
For the year ended 31 December
2023
2022
LKR ‘000
LKR ‘000
Interest income
225
219
Interest expenses
29,933
7,442
Compensation to KMP
29,969
35,716
(b) Items in statement of financial position
KMP and CFMs
As at 31 December
2023
2022
LKR ‘000
LKR ‘000
Assets
Loans
5,015
3,275
Credit cards
130
-
5,145
3,275
Liabilities
Due to depositors
191,458
117,663
191,458
117,663

(c) Off balance sheet items
KMP and CFMs
As at 31 December
2023
2022
LKR ‘000
LKR ‘000
Undrawn facilities
1,770
759
1,770
759
(d) Average accommodations/ due to depositors balances
KMP and CFMs
As at 31 December
2023
2022
LKR ‘000
LKR ‘000
Loans
4,145
5,229
Credit cards
65
-
Due to depositors
179,209
115,861
61.3 Transactions with group related parties
The Group related parties include the Subsidiaries and Associates of the Bank.
61.3.1 Transactions with subsidiaries and associate companies of the Bank
The aggregate amount of income and expenses arising from the transactions during the year and amount due to and due from the
relevant related parties and total contract sum of off balance sheet transactions at the year end are summarised below.
(a) Items in statement of profit or loss
Subsidiary companies
Associate companies
For the year ended 31 December
2023
2022
2023
2022
LKR ‘000
LKR ‘000
LKR ‘000
LKR ‘000
Interest income
1,864,026
862,419
115,713
119,006
Interest expenses
1,388,882
456,319
44,655
87,323
Other income
26,333
104,980
1,137
14,637
Other expenses
1,483,517
1,512,585
-
1,170
Dividend income
398,140
93,930
29,286
13,500

(b) Items in statement of financial position
Subsidiary companies
Associate companies
As at 31 December
2023
2022
2023
2022
LKR ‘000
LKR ‘000
LKR ‘000
LKR ‘000
Assets
Loans
1,432,003
1,872,673
510,479
595,678
Overdrafts
76,652
191,645
21,841
19,708
Placements
46,939,042
30,326,587
-
-
Other receivables
2,040,285
1,694,655
-
-
50,487,982
34,085,560
532,320
615,386
Liabilities
Due to depositors
6,311,029
5,291,872
426,019
227,053
Securities sold under repurchase agreements
559,887
182,830
297,171
516,737
Debentures
254,459
258,768
-
-
Other liabilities
270,465
13,179
-
-
7,395,840
5,746,649
723,190
743,790
(c) Off balance sheet items
Subsidiary companies
Associate companies
As at 31 December
2023
2022
2023
2022
LKR ‘000
LKR ‘000
LKR ‘000
LKR ‘000
Guarantees
130,600
108,880
-
-
Letters of credit
-
489
-
-
Undrawn facilities
163,369
166,050
100,000
30,000
293,969
275,419
100,000
30,000
(d) Average accommodations / due to depositors balances
Subsidiary companies
Associate companies
As at 31 December
2023
2022
2023
2022
LKR ‘000
LKR ‘000
LKR ‘000
LKR ‘000
Loans
1,652,338
1,252,560
553,078
488,625
Overdrafts
134,149
194,282
20,775
52,605
Due to depositors
5,801,450
4,865,466
326,536
231,245

61.3.2 Transactions with subsidiaries and associate companies of the Group
In addition to the transactions between the Bank and its Subsidiaries and Associate companies, transactions which were taken place
between the Subsidiaries and Associate companies are also included in the section below;
(a) Items in statement of profit or loss
Subsidiary companies
Associate companies
For the year ended 31 December
2023
2022
2023
2022
LKR ‘000
LKR ‘000
LKR ‘000
LKR ‘000
Interest income
1,898,640
909,797
115,713
119,006
Interest expenses
1,423,496
503,697
44,655
87,323
Other income
178,654
251,354
-
16,829
Other expenses
1,635,838
1,661,151
-
1,170
(b) Items in statement of financial position
Subsidiary companies
Associate companies
As at 31 December
2023
2022
2023
2022
LKR ‘000
LKR ‘000
LKR ‘000
LKR ‘000
Assets
Loans
1,659,480
2,053,064
510,479
595,678
Overdrafts
76,652
191,645
21,841
19,708
Placements
46,939,042
30,326,587
-
-
Other receivables
2,041,968
1,750,737
-
-
50,717,142
34,322,033
532,320
615,386
Liabilities
Due to depositors
6,505,716
5,291,872
426,019
227,053
Securities sold under repurchase agreements
559,887
182,830
297,171
516,737
Debentures
264,650
258,768
-
-
Other liabilities
271,495
249,652
-
-
7,601,748
5,983,122
723,190
743,790
(c) Off balance sheet items
Subsidiary companies
Associate companies
As at 31 December
2023
2022
2023
2022
LKR ‘000
LKR ‘000
LKR ‘000
LKR ‘000
Guarantees
130,600
108,880
-
-
Letters of credit
-
489
-
-
Undrawn facilities
163,369
166,050
100,000
30,000
293,969
275,419
100,000
30,000
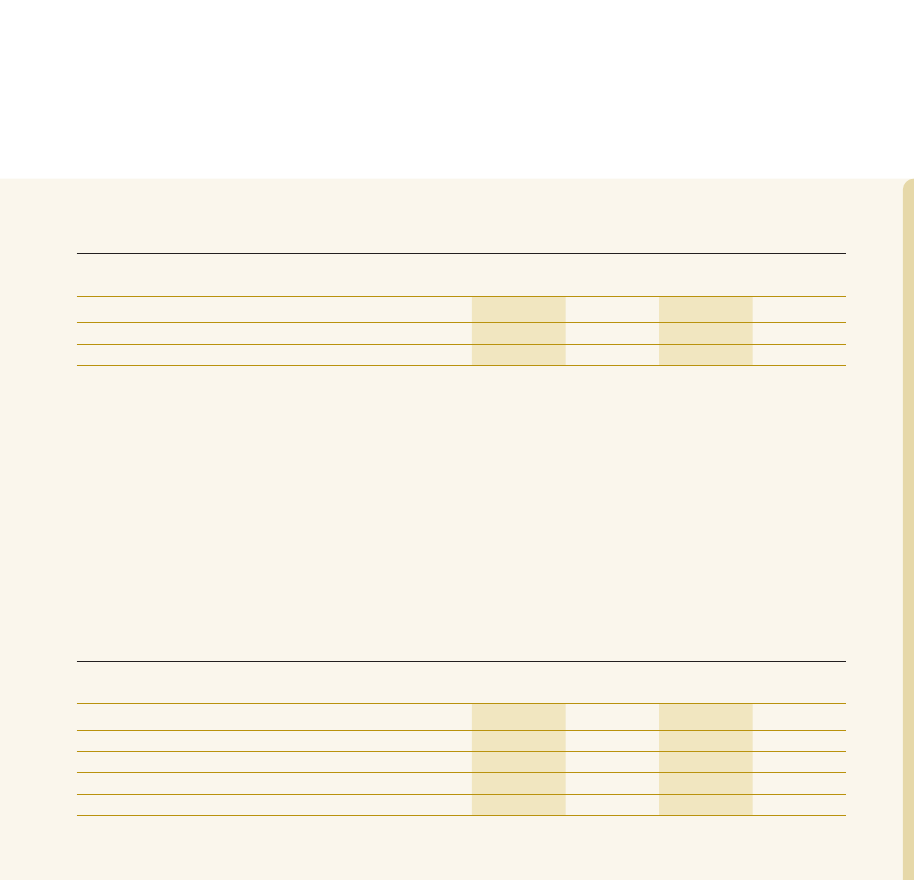
(d) Average accommodations / due to depositors balances
Subsidiary companies
Associate companies
As at 31 December
2023
2022
2023
2022
LKR ‘000
LKR ‘000
LKR ‘000
LKR ‘000
Loans
1,856,272
1,458,957
368,766
488,625
Overdrafts
134,149
194,282
269,289
52,605
Due to depositors
5,898,794
4,895,629
326,536
231,245
61.4 Transactions with the significant investors having significant influence over the bank and the post employment
benefit plans for Bank's employees.
Significant investor of the Bank is the Government as it is a state owned entity. The Government refers to the Government of Sri
Lanka, Government Corporations, Provincial Councils, Local Government bodies, other Government entities and their subsidiaries.
Post employment benefit plans are arrangements made by the Bank to provide post employment benefits for its employees.
Transactions and arrangements entered in to by the Bank with the Government and Government controlled entities (significant
investor) and post employment benefit plans which are individually significant and for other transactions that are collectively, but not
individually significant are as follows;
61.4.1 Transactions which are collectively significant
(a) Items in statement of profit or loss
Significant Investor
Post employment benefit plans
For the year ended 31 December
2023
2022
2023
2022
LKR ‘000
LKR ‘000
LKR ‘000
LKR ‘000
Interest income
330,882,356
319,063,455
-
-
Other income
1,921,419
277,852
-
-
Interest expenses
106,850,702
66,885,196
17,600,024
9,989,149
Dividends paid
173,205
346,410
-
-
Contribution made
-
-
2,849,897
2,815,191

(b) Items in statement of financial position
Significant investor
Post employment benefit plans
As at 31 December
2023
2022
2023
2022
LKR ‘000
LKR ‘000
LKR ‘000
LKR ‘000
Assets
Loans and advances
864,638,635
1,062,191,022
-
-
Investment in securities and bonds
1,734,689,360
1,567,495,084
-
-
Investment in equity instruments
202,038
303,126
-
-
2,599,530,033
2,629,989,232
-
-
Liabilities
Due to depositors
904,339,560
437,961,856
109,015,259
94,737,605
Securities sold under repurchase agreements
69,571,909
171,015,765
-
1,001,732
Debentures
43,463,514
37,612,087
5,169,439
13,731,239
1,017,374,983
646,589,708
114,184,698
109,470,576
(c) Off balance sheet items
Significant investor
As at 31 December
2023
2022
LKR ‘000
LKR ‘000
Letters of credit
124,904,415
116,007,596
Bills and acceptances
660,539
7,941,501
Guarantees
7,189,522
5,239,135
Forward exchange contracts and currency swaps
155,122,950
46,285,145
287,877,426
175,473,377
(d) Other transactions
Significant Investor
For the year ended 31 December
2023
2022
LKR ‘000
LKR ‘000
Gross foreign exchange transactions
Sales
454,526,076
770,090,819
Purchases
191,168,876
544,199,426

(e) Average accommodations / Due to depositors balances
Significant investor
Post employment benefit plans
As at 31 December
2023
2022
2023
2022
LKR ‘000
LKR ‘000
LKR ‘000
LKR ‘000
Loans and advances
432,319,318
1,125,832,324
-
-
Due to depositors
671,150,708
481,371,062
101,876,432
86,863,396
Off balance sheet facilities
100,704,048
189,132,490
-
-
61.4.2 Transactions which are individually significant
The Bank uses internal assessment methodology in order to identify significance of the transactions with the Government and
Government related entities. Accordingly, the transactions which have been considered in normal day to day business operations
which are carried on normal market conditions are considered as individually significant transactions.
The Government has issued Treasury Guarantees of LKR 268,537 million (2022 - LKR 779,009 million) and Comfort Letters of
LKR 32,392 million (2022 - LKR 52,676 million) as of 31.12.2023 against the Loan facilities granted to State Owned Enterprises (SOEs).
61.4.3 Transactions with the significant investor - Group
Other than the transactions carried out by the Bank and balances held by the Bank with the Government, subsidiaries of the Group
have carried out following transactions with the Government and balances held with the Government as follows;
Significant investor
As at 31 December
2023
2022
LKR ‘000
LKR ‘000
Investment in securities and bonds
13,541,640
6,360,146
Nostro balance with Central Bank of Sri Lanka
41,400
43,882
Income from investments in securities and bonds
1,889,067
735,849
Apart from the transactions listed above, the Group carried out transactions with the Government of Sri Lanka and other Government
related entities in the form of providing services, investments in shares for trading purpose and other financial service transactions
including inter bank placements during the year ended 31 December 2023 on comparable terms, which are applicable to transactions
between the Group and its unrelated customers.
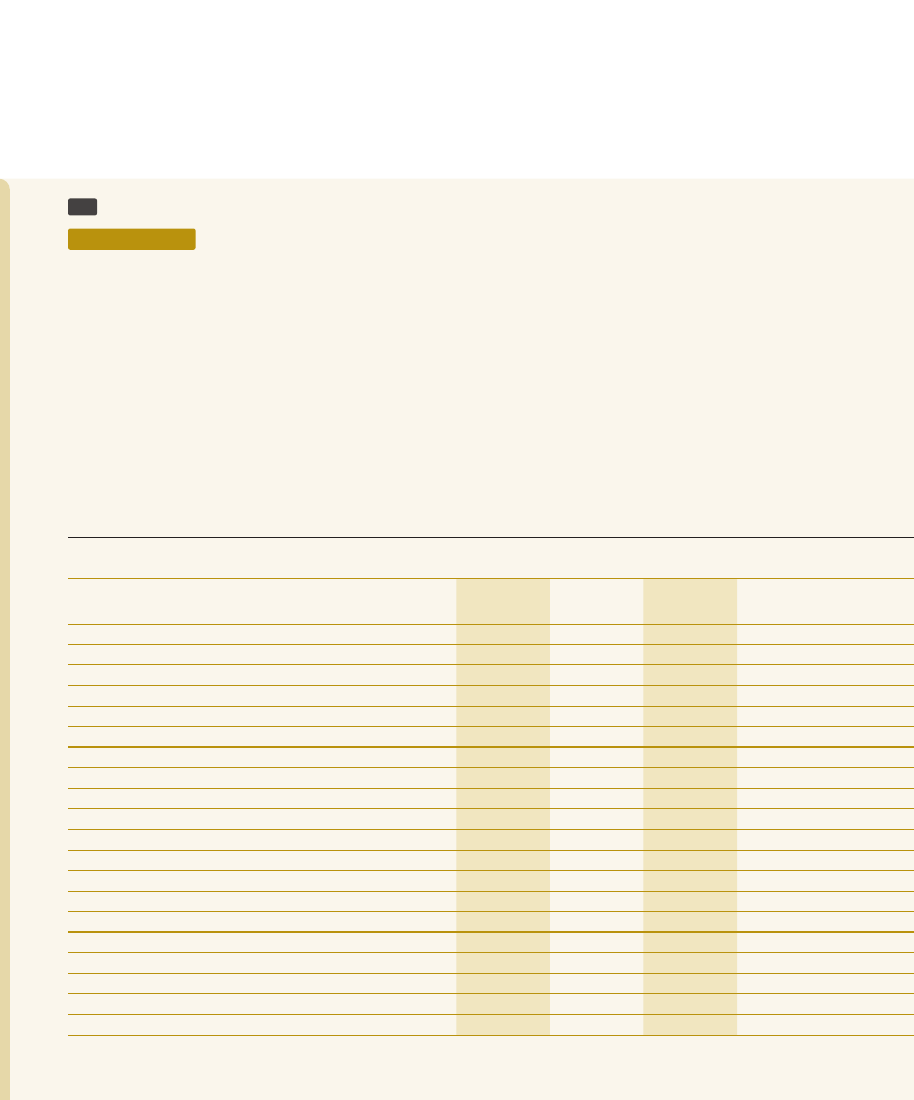
62
Financial reporting by segment
Accounting policy
Segmental information is presented in respect of Group business distinguishing the component of the Group that is engaged in
different business segments or operations within a particular economic environment, which is subject to risk and returns that are
different from those of other segments.
62.1 Primary segment information - Operating segments - Group
An operating segment is a component of the Group that engages in business activities, from which it may earn revenues and incur
expenses, including revenues and expenses that relating to transactions with any of the Group’s other components, whose operating
results are reviewed by the management to make decision about resource allocation to each segment and assess its performance.
The Group comprises the following major business segments: Retail banking, Corporate banking, International, Treasury and
Investments, other unallocated and group functions.
The management monitors the operating results of its business segments separately for the purpose of making decisions about
resources allocation and performance assessment. Segment performance are evaluated based on their operating profits or losses.
Taxes on financial services and Income tax are managed on a Group basis and are not allocated to operating segments.
Retail banking
Corporate banking
For the year ended 31 December
2023
2022
2023
2022
LKR ‘000
LKR ‘000
LKR ‘000
LKR ‘000
Revenue from external customers
Net interest income
29,611,599
34,752,005
25,065,547
70,584,955
Net fee and commission income
14,566,383
11,549,471
3,481,833
3,907,387
Other income
343,271
2,238,543
(905,468)
5,345,531
Total operating income
44,521,253
48,540,019
27,641,912
79,837,873
Impairment (charge)/reversal for loans and other losses
633,347
(10,971,334)
1,190,236
(56,451,115)
Other operating expenses
(38,171,955)
(34,352,551)
(4,548,108)
(4,788,243)
Total expenses
(37,538,608)
(45,323,885)
(3,357,872)
(61,239,358)
Operating profit before taxes on financial services
6,982,645
3,216,134
24,284,040
18,598,515
Taxes on financial services
-
-
-
-
Operating profit after taxes on financial services
6,982,645
3,216,134
24,284,040
18,598,515
Share of profit/(loss) of associate companies, net of tax
-
-
-
-
Profit/ (loss) before income tax
6,982,645
3,216,134
24,284,040
18,598,515
Income tax expense
-
-
-
-
Profit for the year
-
-
-
-
Total assets
840,145,928
891,862,461
1,064,418,496
1,188,838,332
Total liabilities
792,210,941
839,585,417
1,003,687,514
1,119,153,872
Cash flows from/ (used in) operating activities
26,044,438
59,116,463
16,170,212
97,233,846
Cash flows from/ (used in) investing activities
7,810,827
(2,627,276)
9,895,886
(3,502,116)
Cash flows from/ (used in) financing activities
(16,147,855)
(31,005,103)
(20,458,440)
(41,329,304)
Capital expenditure to non current assets
-
-
-
-
Depreciation and amortisation expenses
733,728
881,670
929,593
1,175,251
As the major customer of the Bank the transactions with, “Government and State Owned Enterprises (SOEs)’ are included
under Retail, Corporate and International, Treasury and Investment segments. More details are given in the
Note 61 -”Related Party Disclosures”.
Retail banking
Corporate banking
International, treasury
and investment
Group function
Unallocated
Total
For the year ended 31 December
2023
2022
2023
2022
2023
2022
2023
2022
2023
2022
2023
2022
LKR ‘000
LKR ‘000
LKR ‘000
LKR ‘000
LKR ‘000
LKR ‘000
LKR ‘000
LKR ‘000
LKR ‘000
LKR ‘000
LKR ‘000
LKR ‘000
Revenue from external customers
Net interest income
29,611,599
34,752,005
25,065,547
70,584,955
36,941,352
21,922,324
4,322,527
3,422,514
(430,913)
(912,906)
95,510,112
129,768,892
Net fee and commission income
14,566,383
11,549,471
3,481,833
3,907,387
(1,081,549)
341,435
343,521
308,706
687,751
553,349
17,997,939
16,660,348
Other income
343,271
2,238,543
(905,468)
5,345,531
(8,863,255)
26,325,024
1,639,270
478,030
939,859
135,008
(6,846,323)
34,522,136
Total operating income
44,521,253
48,540,019
27,641,912
79,837,873
26,996,548
48,588,783
6,305,318
4,209,250
1,196,697
(224,549)
106,661,728
180,951,376
Impairment (charge)/reversal for loans and other losses
633,347
(10,971,334)
1,190,236
(56,451,115)
3,002,967
(19,479,956)
142,389
(139,209)
79,727
(253,291)
5,048,666
(87,294,905)
Other operating expenses
(38,171,955)
(34,352,551)
(4,548,108)
(4,788,243)
(8,944,234)
(7,741,813)
(4,758,355)
(3,987,823)
(592,400)
(413,882)
(57,015,052)
(51,284,312)
Total expenses
(37,538,608)
(45,323,885)
(3,357,872)
(61,239,358)
(5,941,267)
(27,221,769)
(4,615,966)
(4,127,032)
(512,673)
(667,173)
(51,966,386)
(138,579,217)
Operating profit before taxes on financial services
6,982,645
3,216,134
24,284,040
18,598,515
21,055,281
21,367,014
1,689,352
82,218
684,024
(891,722)
54,695,342
42,372,159
Taxes on financial services
-
-
-
-
-
-
-
-
-
-
(12,955,824)
(11,442,505)
Operating profit after taxes on financial services
6,982,645
3,216,134
24,284,040
18,598,515
21,055,281
21,367,014
1,689,352
82,218
684,024
(891,722)
41,739,518
30,929,654
Share of profit/(loss) of associate companies, net of tax
-
-
-
-
-
-
33,507
122,847
-
-
33,507
122,847
Profit/ (loss) before income tax
6,982,645
3,216,134
24,284,040
18,598,515
21,055,281
21,367,014
1,722,859
205,065
684,024
(891,722)
41,773,025
31,052,501
Income tax expense
-
-
-
-
-
-
-
-
-
-
(14,155,438)
796,516
Profit for the year
-
-
-
-
-
-
-
-
-
-
27,617,587
31,849,017
Total assets
840,145,928 891,862,461 1,064,418,496 1,188,838,332
2,269,293,594
2,084,601,281
56,011,701
54,308,859
237,890,298
171,157,628
4,467,760,017
4,390,768,561
Total liabilities
792,210,941 839,585,417 1,003,687,514 1,119,153,872
2,139,817,803
1,962,411,148
35,147,634
35,962,464
224,317,339
161,125,126
4,195,181,231
4,118,238,027
Cash flows from/ (used in) operating activities
26,044,438
59,116,463
16,170,212
97,233,846
15,792,681
59,175,852
(3,124,890)
9,238,003
700,055
(273,476)
55,582,496
224,490,688
Cash flows from/ (used in) investing activities
7,810,827
(2,627,276)
9,895,886
(3,502,116)
21,097,596
(6,140,882)
264,103
(1,881,901)
2,211,664
(504,201)
41,280,076
(14,656,376)
Cash flows from/ (used in) financing activities
(16,147,855)
(31,005,103)
(20,458,440)
(41,329,304)
(43,616,498)
(72,470,005)
(2,231,770)
484,184
(4,572,323)
(5,950,240)
(87,026,886)
(150,270,468)
Capital expenditure to non current assets
-
-
-
-
-
-
-
-
-
-
(3,960,044)
(3,332,076)
Depreciation and amortisation expenses
733,728
881,670
929,593
1,175,251
1,981,852
2,060,777
376,311
220,469
207,758
169,201
4,229,242
4,507,368
As the major customer of the Bank the transactions with, “Government and State Owned Enterprises (SOEs)’ are included
under Retail, Corporate and International, Treasury and Investment segments. More details are given in the
Note 61 -”Related Party Disclosures”.
62.2 Secondary segment information - Geographical segments
Geographical segments provide products or services within a particular economic environment where risk and returns are different
from those of other economic environments.
These segment comprise Domestic Operations, Offshore Banking Division and Overseas Banking divisions.
Bank
Group
2023
2022
2023
2022
LKR ‘000
%
LKR ‘000
%
LKR ‘000
%
LKR ‘000
%
Assets
Domestic banking operation
4,182,452,546
94.8
4,009,327,266
92.5
4,174,226,921
93.4
4,012,701,218
91.4
Offshore and overseas
banking operation
229,295,769
5.2
327,132,438
7.5
293,533,096
6.6
378,067,343
8.6
Total assets
4,411,748,315
100.0
4,336,459,704
100.0
4,467,760,017
100.0
4,390,768,561
100.0
Total income
Domestic banking operation
494,471,673
91.2
470,626,232
91.7
501,119,950
90.8
477,005,628
91.6
Offshore and overseas
banking operation
47,715,624
8.8
42,523,103
8.3
50,746,813
9.2
43,885,536
8.4
Total Income
542,187,297
100.0
513,149,335
100.0
551,866,763
100.0
520,891,164
100.0
Profit Before Tax
Domestic banking operation
24,844,602
61.6
5,331,171
17.2
25,844,435
61.9
5,461,116
17.6
Offshore and overseas
banking operation
15,497,821
38.4
25,645,478
82.8
15,928,590
38.1
25,591,385
82.4
Total profit before tax
40,342,423
100.0
30,976,649
100.0
41,773,025
100.0
31,052,501
100.0
Profit after tax
Domestic banking operation
15,845,774
59.4
13,365,740
41.8
16,339,066
59.2
13,296,444
41.7
Offshore and overseas
banking operation
10,847,752
40.6
18,606,668
58.2
11,278,521
40.8
18,552,573
58.3
Total profit after tax
26,693,526
100.0
31,972,408
100.0
27,617,587
100.0
31,849,017
100.0
63
Fair values of assets and liabilities
Accounting policy
"Fair value" is the price that would be received to sell an asset or paid to transfer a liability (exit price) in an orderly transaction
between market participants at the measurement date in the principal or, in its absence, the most advantageous market to which the
Group has access at that date. The fair value of a liability reflects its non-performance risk.
The fair value measurement is based on the presumption that the transaction to sell the asset or transfer the liability takes place
either:
- in the principal market for the asset or liability or
- in the absence of a principal market, in the most advantageous market for the asset or liability.
All assets and liabilities for which fair value is measured or disclosed in the financial statements are categorised within the fair value
hierarchy, described as follows, based on the lowest level input that is significant to the fair value measurement as a whole:

Valuation technique using quoted market price:
Financial instruments with quoted prices for identical instruments in active markets
Valuation technique using observable inputs:
Financial instruments with quoted prices for similar instruments in active markets or quoted prices for identical or similar
instruments in inactive markets and financial instruments valued using models where all significant inputs are observable.
Valuation technique with significant unobservable inputs:
Financial instruments valued using valuation techniques where one or more significant inputs are unobservable.
For all financial instruments where fair values are determined by referring to externally quoted prices or observable pricing inputs to
models, independent price determination or validation is obtained. In an inactive market, direct observation of a traded price may not
be possible. In these circumstances, the Bank uses alternative market information to validate the financial instrument's fair value, with
greater weight given to information that is considered to be more relevant and reliable.
63.1 Assets and liabilities measured at fair value
Derivative financial instruments
All derivative financial instruments are classified as "Held for Trading" are valued using a valuation technique with market observable
and market unobservable inputs. The most frequently applied valuation technique include forward foreign exchange spot and forward
premiums.
Financial assets recognised through Profit or Loss - Measured at fair value
Financial instruments are classified as fair value through profit or loss consists Government securities, Quoted debt securities, Units
in units trusts and Quoted equities. Government securities are valued using yield curve published by the Central Bank of Sri Lanka
and the Bank uses quoted market prices in the active market for the valuation of quoted equities and quoted debt securities as at the
reporting date. Units in units trusts are valued using manager’s buying price of such asset management company since it is the most
relevant exit price of such assets.
Financial assets measured at fair value through OCI
Financial investments are classified as fair value through OCI consists Government securities, Quoted equities and Unquoted equities.
- Government securities are valued using yield curve published by the Central Bank of Sri Lanka as at the reporting date.
- The Bank uses quoted market prices in the active market for the valuation of quoted equities and quoted debt securities as at the
reporting date.
- Unquoted equities are carried at cost except Regional Development Bank investment in shares since it is the most reasonable
value available to represents the price of such securities. Fair value of Regional Development Bank derived using an internal
management valuation technique which details are given in Note 63.1.3
Property, plant and equipment
Freehold lands and buildings and buildings on leasehold lands are carried at revalued amount less any subsequent accumulated
depreciation and impairment losses.
Level
1
Level
2
Level
3

63.1.1 Assets measured at fair value - fair value hierarchy
Bank
Group
As at 31 December 2023
Level 1
Level 2
Level 3
Total
Level 1
Level 2
Level 3
Total
LKR ‘000
LKR ‘000
LKR ‘000
LKR ‘000
LKR ‘000
LKR ‘000
LKR ‘000
LKR ‘000
Financial assets
Derivative financial instruments
Forward exchange contracts
- 4,415,152
- 4,415,152
- 4,415,152
- 4,415,152
Currency SWAPs
-
- 16,110,688 16,110,688
-
- 16,110,688 16,110,688
- 4,415,152 16,110,688 20,525,840
- 4,415,152 16,110,688 20,525,840
Financial assets recognised
through profit or loss measured at
fair value
Government securities
Treasury bills
33,975,090
-
- 33,975,090 33,975,090
-
- 33,975,090
Treasury bonds
69,691
-
-
69,691 7,876,803
-
- 7,876,803
Quoted equities
2,231,452
-
- 2,231,452 2,594,267
-
- 2,594,267
Units in unit trusts
- 4,366,297
- 4,366,297
- 4,384,711
- 4,384,711
36,276,233 4,366,297
- 40,642,530 44,446,160 4,384,711
- 48,830,871
Financial assets measured at fair
value through OCI
Quoted investments
Government securities in Sri Lanka
Treasury bills
27,551,288
-
- 27,551,288 27,551,288
-
- 27,551,288
Treasury bonds
12,020,034
-
- 12,020,034 12,106,493
-
- 12,106,493
Government securities in India
2,866,609
-
- 2,866,609 2,866,609
-
- 2,866,609
Equities
2,949,810
-
- 2,949,810 5,528,440
-
- 5,528,440
Unquoted investments
Equities
- 3,911,244
235,013 4,146,257
- 3,911,244
235,611 4,146,855
45,387,741 3,911,244
235,013 49,533,998 48,052,830 3,911,244
235,611 52,199,685
Total financial assets
81,663,974 12,692,693 16,345,701 110,702,368 92,498,990 12,711,107 16,346,299 121,556,396
Non financial assets
Property, plant and equipment
-
- 36,153,341 36,153,341
-
- 52,478,248 52,478,248
Total non financial assets
-
- 36,153,341 36,153,341
-
- 52,478,248 52,478,248
Total
81,663,974 12,692,693 52,499,042 146,855,709 92,498,990 12,711,107 68,824,547 174,034,644
Financial liabilities
Derivative financial instruments
Forward exchange contracts
-
79,062
-
79,062
-
79,062
-
79,062
Currency SWAPs
-
- 2,090,140 2,090,140
-
- 2,090,140 2,090,140
Total financial liabilities
-
79,062 2,090,140 2,169,202
-
79,062 2,090,140 2,169,202

Bank
Group
As at 31 December 2022
Level 1
Level 2
Level 3
Total
Level 1
Level 2
Level 3
Total
LKR ‘000
LKR ‘000
LKR ‘000
LKR ‘000
LKR ‘000
LKR ‘000
LKR ‘000
LKR ‘000
Financial assets
Derivative financial instruments
Forward exchange contracts
-
3,045
-
3,045
-
3,045
-
3,045
Currency SWAPs
-
- 57,152,441 57,152,441
-
- 57,152,441 57,152,441
-
3,045 57,152,441 57,155,486
-
3,045 57,152,441 57,155,486
Financial assets recognised
through profit or loss measured at
fair value
Government securities
Treasury bills
3,408,566
-
- 3,408,566 3,408,566
-
- 3,408,566
Treasury bonds
459,119
-
-
459,119
459,119
-
-
459,119
Quoted equities
2,387,814
-
- 2,387,814 2,681,665
-
- 2,681,665
Units in unit trusts
- 4,024,556
- 4,024,556
- 4,086,840
- 4,086,840
6,255,499 4,024,556
- 10,280,055 6,549,350 4,086,840
- 10,636,190
Financial assets measured at fair
value through OCI
Quoted investments
Government securities in Sri Lanka
Treasury bills
-
-
-
-
-
-
-
-
Treasury bonds
326,563
-
-
326,563
326,563
-
-
326,563
Government securities in India
3,034,704
-
- 3,034,704 3,034,704
-
- 3,034,704
Equities
1,543,243
-
- 1,543,243 3,601,623
-
- 3,601,623
Unquoted investments
Equities
- 3,551,279
235,013 3,786,292
- 3,551,279
235,875 3,787,154
4,904,510 3,551,279
235,013 8,690,802 6,962,890 3,551,279
235,875 10,750,044
Total financial assets
11,160,009 7,578,880 57,387,454 76,126,343 13,512,240 7,641,164 57,388,316 78,541,720
Non financial assets
Property, plant and equipment
-
- 28,677,691 28,677,691
-
- 44,420,510 44,420,510
Total non financial assets
-
- 28,677,691 28,677,691
-
- 44,420,510 44,420,510
Total
11,160,009 7,578,880 86,065,145 104,804,034 13,512,240 7,641,164 101,808,826 122,962,230
Financial liabilities
Derivative financial instruments
Forward exchange contracts
-
585,333
-
585,333
-
585,333
-
585,333
Currency SWAPs
-
-
335,700
335,700
-
-
335,700
335,700
Total financial liabilities
-
585,333
335,700
921,033
-
585,333
335,700
921,033
63.1.2 Movements in level 3 assets measured at fair value
The following table shows a reconciliation of the opening and closing amounts of level 3 assets and liabilities which are recorded at
fair value.
Bank
Group
As at 1
January
2023
Total gains/
(losses)
recorded
in profit or
loss
Total gains/
(losses)
recorded
in OCI
Purchases/
(sales)
and other
adjustments
As at 31
December
2023
As at 1
January
2023
Total gains/
(losses)
recorded
in profit or
loss
Total gains/
(losses)
recorded
in OCI
Purchases/
(sales
and other
adjustments
As at 31
December
2023
LKR ‘000
LKR ‘000
LKR ‘000
LKR ‘000
LKR ‘000
LKR ‘000
LKR ‘000
LKR ‘000
LKR ‘000
LKR ‘000
Financial assets
Derivative financial instruments
Currency SWAPs
57,152,441
-
- (41,041,753) 16,110,688 57,152,441
-
- (41,041,753) 16,110,688
Financial assets measured at
fair value through OCI
Unquoted Investments
Equities
235,013
-
-
-
235,013
235,875
-
-
(264)
235,611
Total Level 3 financial assets
57,387,454
-
- (41,041,753) 16,345,701 57,388,316
-
- (41,042,017) 16,346,299
Non financial assets
Property, plant and equipment
28,677,691
(629,122)
6,880,746
1,224,026 36,153,341 44,420,510 (1,195,759)
8,635,144
618,353 52,478,248
Total Level 3 assets
86,065,145
(629,122)
6,880,746 (39,817,727) 52,499,042 101,808,826 (1,195,759)
8,635,144 (40,423,664) 68,824,547
Financial liabilities
Currency SWAPs
335,700
-
-
1,754,440 2,090,140
335,700
-
-
1,754,440 2,090,140
Total Level 3 financial liabilities
335,700
-
-
1,754,440 2,090,140
335,700
-
-
1,754,440 2,090,140
Net Level 3 financial assets
57,051,754
-
- (42,796,193) 14,255,561 57,052,616
-
- (42,796,457) 14,256,159

Bank
Group
As at 1
January
2022
Total gains/
(losses)
recorded
in profit or
loss
Total gains/
(losses)
recorded
in OCI
Purchases/
(sales)
and other
adjustments
As at 31
December
2022
As at 1
January
2022
Total gains/
(losses)
recorded
in profit or
loss
Total gains/
(losses)
recorded
in OCI
Purchases/
(sales)
and other
adjustments
As at 31
December
2022
LKR ‘000
LKR ‘000
LKR ‘000
LKR ‘000
LKR ‘000
LKR ‘000
LKR ‘000
LKR ‘000
LKR ‘000
LKR ‘000
Financial assets
Derivative financial instruments
Currency SWAPs
4,314,973
-
- 52,837,468 57,152,441 4,314,973
-
- 52,837,468 57,152,441
Financial assets measured at
fair value through OCI
Unquoted investments
Equities
235,013
-
-
-
235,013
262,107
-
-
(26,232)
235,875
Total Level 3 financial assets
4,549,986
-
- 52,837,468 57,387,454 4,577,080
-
- 52,811,236 57,388,316
Non financial assets
Property, plant and equipment
26,881,778 (254,695) 1,818,193
232,415 28,677,691 40,631,672 (973,705) 3,695,662 1,066,881 44,420,510
Total Level 3 assets
31,431,764 (254,695) 1,818,193 53,069,883 86,065,145 45,208,752 (973,705) 3,695,662 53,878,117 101,808,826
Financial liabilities
Currency SWAPs
363,031
-
-
(27,331)
335,700
363,031
-
-
(27,331)
335,700
Total Level 3 financial liabilities
363,031
-
-
(27,331)
335,700
363,031
-
-
(27,331)
335,700
Net Level 3 financial assets
4,186,955
-
- 52,864,799 57,051,754 4,214,049
-
- 52,838,567 57,052,616
63.1.3 Unobservable inputs used in measuring fair value of Level 3
The table below sets out information about significant unobservable inputs used as at 31 December 2023 in measuring financial
instruments categorised as level 3 in the fair value hierarchy.
Type of financial instrument
Fair value as at
31 December
2023
LKR’000
Valuation
technique
Significant
unobservable
input
Range of estimates
(weighted average)
for unobservable
input
Fair value measurement
sensitivity to unobservable
input
Derivative Financial
Instruments
Currency SWAPs
16,110,688 Forward pricing
model
Foreign
exchange
forward rate.
Negative 100 to
positive 100 basis
point.
Unfavourable or favourable
impact on derivative assets
value of LKR 161.1 million
respectively.
Financial assets measured
at fair value through OCI
Unquoted Equity Shares
Regional Development Bank
162,300 Discounted
Cash Flow
method
Constant
Dividend
model
Decreased by 5%
and increased by
5% for existing cost
of capital.
Impact to the fair value
will be within negative and
positive LKR 8.1 million, no
significant impact to the
investment.
Credit Information Bureau
of Sri Lanka
43,645 Value at cost
-
Fair value cannot be
reliably measured. These
are investments in mutual
entities that provide
transaction processing
and transaction services to
members on a pricing basis
intended to recover the
entities operating cost.
Lanka Clear (Private) Limited
23,443 Value at cost
-
Lanka Financial Services
Bureau Limited
5,000 Value at cost
-
Fitch Ratings Lanka Limited
625 Value at cost
-
Fair value cannot be reliably
measured and Bank used
cost model for valuation.

63.2 Fair value of financial assets and liabilities not carried at fair value
Bank
Group
Fair value
Fair value
As at 31 December 2023
Level 1
Level 2
Level 3
Total
Carrying
value
Level 1
Level 2
Level 3
Total
Carrying
value
LKR ‘000
LKR ‘000
LKR ‘000
LKR ‘000
LKR ‘000
LKR ‘000
LKR ‘000
LKR ‘000
LKR ‘000
LKR ‘000
Assets
Financial assets at amortised cost
Loans and advances
-
- 2,268,559,761 2,268,559,761 2,209,061,924
-
- 2,300,958,799 2,300,958,799 2,240,611,228
Debt and other instruments
1,544,306,801
52,349,359
- 1,596,656,160 1,653,728,403 1,550,209,345
52,349,359
- 1,602,558,704 1,660,012,978
Investment properties
-
-
3,003,007
3,003,007
2,414,640
-
-
653,000
653,000
95,446
Total
1,544,306,801
52,349,359 2,271,562,768 3,868,218,928 3,865,204,967 1,550,209,345
52,349,359 2,301,611,799 3,904,170,503 3,900,719,652
Liabilities
Financial liabilities at amortised cost
Due to depositors
-
- 3,935,385,592 3,935,385,592 3,882,232,323
-
- 3,963,108,393 3,963,108,393 3,909,580,686
Other borrowings
-
-
33,666,236
33,666,236
33,666,236
-
-
35,592,741
35,592,741
35,592,741
Debt securities issued
-
-
-
-
-
-
-
730,839
730,839
730,839
Subordinated liabilities
-
8,858,367
52,968,842
61,827,209
64,691,810
-
8,858,367
52,709,250
61,567,617
64,437,320
Total
-
8,858,367 4,022,020,670 4,030,879,037 3,980,590,369
-
8,858,367 4,052,141,223 4,060,999,590 4,010,341,586
Bank
Group
Fair value
Fair value
As at 31 December 2022
Level 1
Level 2
Level 3
Total
Carrying
value
Level 1
Level 2
Level 3
Total
Carrying
value
LKR ‘000
LKR ‘000
LKR ‘000
LKR ‘000
LKR ‘000
LKR ‘000
LKR ‘000
LKR ‘000
LKR ‘000
LKR ‘000
Assets
Financial assets at amortised cost
Loans and advances
-
- 2,170,683,694 2,170,683,694 2,325,594,329
-
- 2,199,043,783 2,199,043,783 2,355,978,333
Debt and other instruments
907,511,589
3,089,117 258,194,481 1,168,795,187 1,555,897,307 913,414,133
3,089,117 258,924,023 1,175,427,273 1,562,373,679
Investment properties
-
-
3,003,007
3,003,007
2,414,640
-
-
653,000
653,000
104,798
Total
907,511,589
3,089,117 2,431,881,182 3,342,481,888 3,883,906,276
913,414,133
3,089,117 2,458,620,806 3,375,124,056 3,918,456,810
Liabilities
Financial liabilities at amortised cost
Due to depositors
-
- 3,294,330,147 3,294,330,147 3,334,774,261
-
- 3,317,470,222 3,317,470,222 3,358,198,424
Other borrowings
-
- 390,489,543 390,489,543 390,489,543
-
- 397,083,583 397,083,583 397,083,583
Debt securities issued
-
-
-
-
-
-
-
58,807
58,807
58,807
Subordinated liabilities
-
4,590,655
48,086,022
52,676,677
63,758,191
-
4,590,655
47,826,430
52,417,085
63,498,599
Total
-
4,590,655 3,732,905,712 3,737,496,367 3,789,021,995
-
4,590,655 3,762,439,042 3,767,029,697 3,818,839,413

The following describes the methodologies and assumptions used to determine fair values for those assets and liabilities which are
not already recorded at fair value in the Financial Statements.
Financial assets measured at amortised cost
Financial assets measured at amortised cost comprise Sri Lanka Sovereign Bonds, Government and Corporate debt securities.
Listed corporate debt securities are valued using quoted market price as of the reporting date, quoted government debt securities
are valued using yield curve published by the Central Bank of Sri Lanka and fair value of unquoted corporate debt securities and
Government securities including fixed rate Sri Lanka Sovereign Bonds are estimated as the present value of future cash flows
expected to be received from such investments calculated based on interest rates at the reporting date for similar instruments.
Investment properties
Investment properties are valued by the independent professional valuers and more details are given in Note 33.
Financial liabilities at amortised cost - other borrowings
Financial liabilities at amortised cost - other borrowings represent Term borrowings from banks and other financial institutions in Sri
lanka and abroad and Refinance borrowings.
Fair value of term borrowings and refinance borrowings are estimated by the discounting the future cash flows using effective interest
rates of similar instruments.
Debt securities issued
Fair value of debt securities issued are estimated as the present value of future cash flows expected to be paid from such investments
calculated based on interest rates at the reporting date for similar instruments.
Subordinated liabilities
Subordinated liabilities that are listed in the Colombo Stock Exchange valued using quoted market price as of the reporting date.
Fair values of unlisted subordinated liabilities are estimated as the present value of future cash out flow expected to be paid to the
instruments calculated based on the interest rates at the reporting date for smiler instruments.

63.3 Assets and liabilities for which fair value approximates carrying value
For financial assets and liabilities that have a short term maturity, it is assumed that the carrying amounts approximate their fair value.
For certain instruments which have contractual maturity of more than one year, the fair value is determined using reasonable basis.
Given below is the bases adopted by the Bank in order to establish the fair values of such financial instruments.
2023
2022
Carrying
Amount
Fair
Value
Carrying
Amount
Fair
Value
LKR ‘000
LKR ‘000
LKR ‘000
LKR ‘000
Bank
Financial assets
Cash and cash equivalents
135,550,505
135,550,505
128,401,532
128,401,532
Balances with Central Banks
34,932,639
34,932,639
70,494,529
70,494,529
Placements with banks
74,966,171
74,966,171
16,459,303
16,459,303
Securities purchased under resale agreements
3,711,918
3,711,918
1,480,403
1,480,403
Total financial assets
249,161,233
249,161,233
216,835,767
216,835,767
Financial liabilities
Due to banks
3,047,732
3,047,732
11,514,897
11,514,897
Securities sold under repurchase agreements
78,463,070
78,463,070
180,218,543
180,218,543
Total financial liabilities
81,510,802
81,510,802
191,733,440
191,733,440
Group
Financial assets
Cash and cash equivalents
137,369,158
137,369,158
135,230,827
135,230,827
Balances with Central Banks
34,932,639
34,932,639
70,494,529
70,494,529
Placements with banks
73,024,979
73,024,979
17,811,665
17,811,665
Securities purchased under resale agreements
3,695,392
3,695,392
1,463,368
1,463,368
Total financial assets
249,022,168
249,022,168
225,000,389
225,000,389
Financial liabilities
Due to banks
3,162,463
3,162,463
11,547,714
11,547,714
Securities sold under repurchase agreements
77,829,770
77,829,770
179,938,744
179,938,744
Total financial liabilities
80,992,233
80,992,233
191,486,458
191,486,458
63.4 Reclassification of financial assets and financial liabilities
There have been no reclassifications during 2023.

64
Financial Risk Management
64.1 Introduction
64.1.1 Overview
Bank exposes to various risks including credit risk, market risk, operational risk and liquidity risk which are inherant in financial
intermediation. The Bank has a well developed, comprehensive Risk Management Framework (RMF) as management of these risks is
vital in sustainable banking business.
Risk Management Framework (RMF) of the Bank provides the consistent guidence to identify, assess, measure, monitor and reporting
of risk to ensure efficeint and effective management with the proper oversight by the Integrated Risk Management Committee
(IRMC). Financial risk together with other material risks faced by the Bank including strategic, reputational, compliance and legal risks
are managed and overseen as a part of the Bank's corporate governance and risk management framework. This note presents the
exposure to risk and the processes of measuring and managing such risks.
General Risk
Liquidity Risk
64.1.2
Group risk management
64.3.1
Liquidity risk exposure
64.1.3 Risk management framework
64.3.2 Maturity analysis of financial assets and liabilities
64.1.4
Risk measurement, reporting and mitigation
Credit Risk
Market Risk
64.2.2 Maximum exposure to credit risk
64.4.1 Trading and non-trading portfolio-Bank
64.2.3 Provisions for impairment (ECL) movement
64.4.2 Interest rate risk
64.2.5
Country wise exposure
64.4.3
Foreign exchange risk
64.2.6
Sector wise exposure
64.4.4
Equity risk
64.2.7 Commitments and guarantees
Operational Risk
Capital Adequacy and Capital Management
64.1.2
Group risk management
Bank of Ceylon group consist of nine financial and non financial subsidiaries, directly and indirectly owned by the Bank and four
associate companies.The diversified businesses are carried out by the group companies in various sectors. Except reputation damage
that could arise the Bank is not exposed to significant subsidiary risk due to the size of balance sheet of the group.
The Bank is managing the strategic risk through comprehensive review of group activities on a quarterly basis mainly in the
perspective of credit, market, liquidty and operational risks which are overseen by the IRMC. Bank closely involves in risk, compliance
and audit affairs of subsidiaries by appointing memebrs of senior management of the Bank as members of the boards of such
companies.
64.1.3 Risk Management Framework (RMF)
Risk management framework of the Bank begins with oversight by the Board of Directors through IRMC and based on the three lines
of defence model which assures the performance of overall risk management. The Board approved RMF consists of clearly defined
governance structures, policy frameworks and a culture of risk awareness which ensures the consistent management of the risk across
the Bank. Therefore, RMF provides a structured approach to manage all the risk exposures through risk management policies, risk
appetite and limit setting of the Bank. This establishes the strategic direction of the Bank and provides a holistic approach to Bank's
risk management.
The Bank’s Independent Integrated Risk Management Division (IIRMD) is headed by the Chief Risk Officer (CRO), who directly reports
to the IRMC, which is a sub-committee of the Board. The business units are the risk owners and have the primary responsibility for
risk management. The IIRMD acts as the second line of defence in risk management. IIRMD reports to the IRMC through CRO who
is also a member of management level committees such as Credit Committee, Asset and Liability Management Committee (ALCO),

Operational Risk Management Executive Committee (ORMEC), Corporate Information Security Committee (CISC) etc., which assist in
managing various risks that the Bank is exposed to.
The internal audit function of the Bank independently monitors and evaluates the risk management function of the Bank as third line
of defence and provides their views on risk management to the audit committee.
64.1.4 Risk measurement, reporting and mitigation
Risks, either internal or external are measured using various techniques and risk management tools inline with the industry best
practices with respect to credit, market, operational, liquidity, information security and other risks. To address the high volatility of
the economy, the Bank carried out comprehensive set of analysis to assess the future risks while increasing the assessment frequency
and escalate to the top management for mitigation actions. The Bank has also carried out stress testing for several single factor, non
conventional wrose case scenarios which are plausible in an irritated economy.
In addition, the Internal Capital Adequacy Assessment Process (ICAAP) assess Bank's capital requirment based on the risk profile
and sets out the framework for the Bank’s internal capital augmentation. The Bank uses different assessment methodologies which
are internationally accepted to measure the pillar 2 risks in addition to pillar 1 risks. The results are reported to the IRMC for timely
decision making that leads to better risk management while complying with the regulatory reporting requirements.
As a part of its overall risk management, the Bank uses several mitigation techniques and strategies to reduce the risk. Bank uses
comprehensive pre sanctioning and post sanctioning techniques to reduce its credit risks. Measurement of environmental and social
risk has been integrated into credit evaluation. Collaterals are used to further mitigation and pricing mechanism ensures facilities
are priced factoring individual rating and availability of collaterals. Market risk exposures including interest rate, foreign exchange
and equity risks are mitigated using derivative instruments in limited context. The Bank addresses the liqudity risk via a robust policy
framework, measurement and mitigation approaches including compherensive stress testing. Operational risk is managed through
strong internal control mechanism, reinforced by the three lines of defence. Insurance is used as an operational risk transfer strategy
where necessary. The most vulnerable risk in the present business enviornment, the IT risk is managed through compherensive
policies and standards.

64.2 Credit Risk
Credit risk is defined as potential losses arising due to a counterparty to a credit transaction failing to meet obligations in accordance
with agreed terms. Credit risk can take the form of default, deterioration of credit quality and concentration.
64.2.1
Management of credit risk
Credit risk management function ensures standard processes and principles are applied to both transaction and portfolio levels.
Credit risk management policies define the conditions and guidelines for evaluation,granting, maintenance, monitoring and
management of credit at corporate and retail segments. Concentration risk is managed by maintaining a diversified credit portfolio
according to the risk appetite limits setout considering the assessment of borrower and industry specific factors.
The Bank has well established process for approving new credit and for the renewal of existing credit. All the potential credit
exposures of the Bank are first evaluated by transaction originators who are the risk owners of the credit mechanism. Credit proposals
exceeding a certain threshold are independently reviewed by the Chief Risk Officer.
Rating models are a key input by which the credit risk in portfolios is managed, measured and monitored. The Bank uses a range
of credit risk rating models across the corporate and mid corporate portfolios covering the different industries the customers are in.
Retail exposures are managed through number of retail scorecards.
Collateral is used for credit risk mitigation purposes and minimises losses that would otherwise be incurred. Collateral may take
various forms depending on the type of borrower, the assets available, the structure and the term of credit obligations. Collateral is
subject to regular valuation as prescribed in the relevant governing policies and standards.
Procedures are also in place to identify the credit exposures vulnerable to increased risk of loss at an early stage. In order to reduce
potential credit losses and to increase the recovery of obligations credit risk mitigants are applied.Post sanctioning review of credit
exposures is carried out to ensure proper documentation, adherence to the covenants, by credit quality assurance units setup at
various level to assure a quality loan book.
Element of credit quality deterioration is captured via expected credit loss as per SLFRS 9 - "Financial Instruments".

64.2.1.1 Calculation of Expected Credit Losses (ECL)
Expected credit loss represents the default events over an expected life time of the financial assets. Expected credit losses are
calculated using three main components, i.e. Probability of Default (PD), Loss Given Default (LGD) and Exposure at Default (EAD).
These parameters are generally derived from internally developed statistical models combined with historical, current and forward-
looking customer and macro-economic data.
SLFRS 9 - "Financial Instruments" introduces a three stage model for impairment of financial assets that are performing at the stage
of origination or purchase. Three stage model for impairment is based on the changes in the credit quality since initial recognition. At
initial recognition, financial assets which are not credit impaired are reflected in stage 1. If there is a significant increase in the credit
risk, such financial assets are transferred to stage 2. Significant increase in the credit risk is defined using pre-determined credit risk
indicators which are stated in the Bank’s impairment policy.In case of objective evidence/default, financial assets are classified as
stage 3.
64.2.1.2 Incorporation of forward-looking information
The Bank has established an expert panel who considers a range of relevant forward-looking macro-economic assumptions for the
determination of unbiased general industry adjustments and any related specific industry adjustments, that support the calculation of
ECLs.
64.2.2 Maximum exposure to credit risk
64.2.2.1 Collateral and other credit enhancements
The Bank obtains different types of collaterals from the counterparties as a credit risk mitigant. The amount and the types of
the collateral required depend on credit risk assessment of the counterparty. The acceptability of the collateral and valuation is
determined based on the guidelines issued by the regulator and the Bank’s policy. The main types of collateral obtained are
• For commercial lending-charges over movable and immovable properties
• For personal lending- mortgages over movable and immovable properties, cash & cash equivalents and gold articles
• For Government & State owned enterprises- Government guarantees
• For reverse repurchase transactions – Government securities
The Bank monitors the market value of collateral and will request additional collateral in accordance with the underlying agreement.
It is the Bank’s policy to dispose of repossessed properties in an orderly fashion. The proceeds are used to reduce or repay the
outstanding claim. In general, the Bank does not occupy repossessed properties for business use.

The following table shows the maximum exposure to credit risk, total fair value of collateral, any surplus collateral and the
net exposure to credit risk.
64.2.2.2 Type of collateral or credit enhancements
31 December 2023
Maximum
exposure to
credit risk
Cash
Gold
LKR ‘000
LKR ‘000
LKR ‘000
Cash and cash equivalents
135,613,096
62,633,164
-
Less : Impairment
(62,591)
-
-
Balances with Central Banks
34,932,639
34,932,639
-
Placements with banks
75,010,950
-
-
Less : Impairment
(44,779)
-
-
Securities purchased under resale agreements
3,711,918
-
-
Derivative financial instruments
20,525,840
-
-
Financial assets recognised through profit or loss - measured at fair value
40,642,530
-
-
Financial assets at amortised cost - loans and advances
2,457,771,739
88,788,133
184,760,416
Less : Impairment
(248,709,815)
-
-
Financial assets at amortised cost - debt and other instruments
1,701,957,323
-
-
Less : Impairment
(48,228,920)
-
-
Financial assets measured at fair value through OCI
49,533,998
-
-
Total
4,222,653,928
186,353,936
184,760,416
31 December 2022
Maximum
exposure to
credit risk
Cash
Gold
LKR ‘000
LKR ‘000
LKR ‘000
Cash and cash equivalents
128,425,687
57,691,482
-
Less : Impairment
(24,155)
-
-
Balances with Central Banks
70,494,529
70,494,529
-
Placements with banks
16,779,252
-
-
Less : Impairment
(319,949)
-
-
Securities purchased under resale agreements
1,480,403
-
-
Derivative financial instruments
57,155,486
-
-
Financial assets recognised through profit or loss - measured at fair value
10,280,055
-
-
Financial assets at amortised cost - loans and advances
2,584,778,967
76,796,221
74,899,955
Less : Impairment
(259,184,638)
-
-
Financial assets at amortised cost - debt and other instruments
1,609,711,362
-
-
Less : Impairment
(53,814,055)
-
-
Financial assets measured at fair value through OCI
8,690,802
-
-
Total
4,174,453,746
204,982,232
74,899,955

The following table shows the maximum exposure to credit risk, total fair value of collateral, any surplus collateral and the
net exposure to credit risk.
64.2.2.2 Type of collateral or credit enhancements
31 December 2023
Value of collateral and credit enhancements held
Maximum
exposure to
credit risk
Cash
Gold
GoSL Securities /
Guarantees
Movables
Immovables
Others
Surplus
Collateral
Net Collateral
Net exposure
LKR ‘000
LKR ‘000
LKR ‘000
LKR ‘000
LKR ‘000
LKR ‘000
LKR ‘000
LKR ‘000
LKR ‘000
LKR ‘000
Cash and cash equivalents
135,613,096
62,633,164
-
-
-
-
-
-
62,633,164
72,979,932
Less : Impairment
(62,591)
-
-
-
-
-
-
-
-
(62,591)
Balances with Central Banks
34,932,639
34,932,639
-
-
-
-
-
-
34,932,639
-
Placements with banks
75,010,950
-
-
-
-
-
-
-
-
75,010,950
Less : Impairment
(44,779)
-
-
-
-
-
-
-
-
(44,779)
Securities purchased under resale agreements
3,711,918
-
-
4,196,000
-
-
-
(484,082)
3,711,918
-
Derivative financial instruments
20,525,840
-
-
-
-
-
-
-
-
20,525,840
Financial assets recognised through profit or loss - measured at fair value
40,642,530
-
-
34,044,786
-
-
-
-
34,044,786
6,597,744
Financial assets at amortised cost - loans and advances
2,457,771,739
88,788,133
184,760,416
678,707,929
53,620,380
323,912,510
75,946,648
(241,505,442)
1,164,230,574
1,293,541,165
Less : Impairment
(248,709,815)
-
-
-
-
-
-
-
-
(248,709,815)
Financial assets at amortised cost - debt and other instruments
1,701,957,323
-
-
1,612,480,612
-
-
-
-
1,612,480,612
89,476,711
Less : Impairment
(48,228,920)
-
-
-
-
-
-
-
-
(48,228,920)
Financial assets measured at fair value through OCI
49,533,998
-
-
42,437,930
-
-
-
-
42,437,930
7,096,068
Total
4,222,653,928
186,353,936
184,760,416
2,371,867,257
53,620,380
323,912,510
75,946,648
(241,989,524)
2,954,471,623
1,268,182,305
31 December 2022
Value of collateral and credit enhancements held
Maximum
exposure to
credit risk
Cash
Gold
GoSL Securities /
Guarantees
Movables
Immovables
Others
Surplus
Collateral
Net Collateral
Net exposure
LKR ‘000
LKR ‘000
LKR ‘000
LKR ‘000
LKR ‘000
LKR ‘000
LKR ‘000
LKR ‘000
LKR ‘000
LKR ‘000
Cash and cash equivalents
128,425,687
57,691,482
-
-
-
-
-
-
57,691,482
70,734,205
Less : Impairment
(24,155)
-
-
-
-
-
-
-
-
(24,155)
Balances with Central Banks
70,494,529
70,494,529
-
-
-
-
-
-
70,494,529
-
Placements with banks
16,779,252
-
-
-
-
-
-
-
-
16,779,252
Less : Impairment
(319,949)
-
-
-
-
-
-
-
-
(319,949)
Securities purchased under resale agreements
1,480,403
-
-
1,872,710
-
-
-
(392,307)
1,480,403
-
Derivative financial instruments
57,155,486
-
-
-
-
-
-
-
-
57,155,486
Financial assets recognised through profit or loss - measured at fair value
10,280,055
-
-
3,867,685
-
-
-
-
3,867,685
6,412,370
Financial assets at amortised cost - loans and advances
2,584,778,967
76,796,221
74,899,955
805,519,532
135,237,450
397,650,677
96,197,997
(57,247,702)
1,529,054,130
1,055,724,837
Less : Impairment
(259,184,638)
-
-
-
-
-
-
-
-
(259,184,638)
Financial assets at amortised cost - debt and other instruments
1,609,711,362
-
-
1,320,396,629
-
-
-
-
1,320,396,629
289,314,733
Less : Impairment
(53,814,055)
-
-
-
-
-
-
-
-
(53,814,055)
Financial assets measured at fair value through OCI
8,690,802
-
-
3,361,266
-
-
-
-
3,361,266
5,329,536
Total
4,174,453,746
204,982,232
74,899,955
2,135,017,822
135,237,450
397,650,677
96,197,997
(57,640,009)
2,986,346,124
1,188,107,622

64.2.3 Provision for impairment (ECL) movement
The following tables show reconciliations from the opening to closing balance of the provision for impairment by class of financial
instrument.
As at 31 December 2023
Note
12-month
ECL
Lifetime
ECL - not credit
impaired
Lifetime
ECL - credit
impaired
Total
(Stage 1)
(Stage 2)
(Stage 3)
LKR. ’000
LKR. ’000
LKR. ’000
LKR. ’000
Cash and cash equivalents
22
Provision for impairment (ECL) as at 1 January 2023
24,155
-
-
24,155
Transfer to Stage 1
-
-
-
-
Transfer to Stage 2
-
-
-
-
Transfer to Stage 3
-
-
-
-
Net remeasurement of impairment
-
-
-
-
New assets originated or purchased
62,591
-
-
62,591
Financial assets derecognised or repaid (excluding write-offs)
(24,155)
-
-
(24,155)
Foreign exchange adjustments
-
-
-
-
As at 31 December 2023
62,591
-
-
62,591
Placements with Central Banks and Other Banks
24
Provision for impairment (ECL) as at 1 January 2023
319,949
-
-
319,949
Transfer to Stage 1
-
-
-
-
Transfer to Stage 2
-
-
-
-
Transfer to Stage 3
-
-
-
-
New remeasurement of impairment
-
-
-
-
New assets originated or purchased
44,779
-
-
44,779
Financial assets derecognised or repaid (excluding write-offs)
(319,949)
-
-
(319,949)
Foreign exchange adjustments
-
-
-
-
As at 31 December 2023
44,779
-
-
44,779
Financial assets at amortised cost - Loans and advances to other
customers
28
Provision for impairment (ECL) as at 1 January 2023
39,710,949
25,419,553
194,054,136
259,184,638
Transfer to Stage 1
1,969,297
(1,294,073)
(675,224)
-
Transfer to Stage 2
(1,742,042)
2,134,331
(392,289)
-
Transfer to Stage 3
(116,919)
(838,089)
955,008
-
Net remeasurement of impairment
(11,591,275)
3,980,308
9,091,829
1,480,861
New assets originated or purchased
3,810,285
2,281,108
4,403,663
10,495,057
Write-offs and recoveries
-
-
(86,065)
(86,065)
Foreign exchange adjustments
(627,821)
(2,865,342)
(4,317,816)
(7,810,979)
Interest accrued on impaired loans and advances
-
-
(14,639,762)
(14,639,762)
Other movements
-
-
86,065
86,065
As at 31 December 2023
31,412,474
28,817,796
188,479,545
248,709,815
Financial assets at amortised cost - Debt and other financial instruments
29
Provision for impairment (ECL) as at 1 January 2023
323,914
53,461,827
28,314
53,814,055
Transfer to Stage 1
-
-
-
-
Transfer to Stage 2
-
-
-
-
Transfer to Stage 3
-
-
-
-
Net remeasurement of impairment
2,370
10,341,661
-
10,344,031
New assets originated or purchased
-
-
-
-
Financial assets derecognised or repaid (excluding write-offs)
(323,237)
(12,026,493)
-
(12,349,730)
Foreign exchange adjustments
-
(3,579,436)
-
(3,579,436)
As at 31 December 2023
3,047
48,197,559
28,314
48,228,920

As at 31 December 2022
Note
12-month
ECL
Lifetime
ECL - not credit
impaired
Lifetime
ECL - credit
impaired
Total
(Stage 1)
(Stage 2)
(Stage 3)
LKR. ’000
LKR. ’000
LKR. ’000
LKR. ’000
Cash and cash equivalents
22
Provision for impairment (ECL) as at 1 January 2022
12,203
-
-
12,203
Transfer to Stage 1
-
-
-
-
Transfer to Stage 2
-
-
-
-
Transfer to Stage 3
-
-
-
-
Net remeasurement of impairment
-
-
-
-
New assets originated or purchased
24,155
-
-
24,155
Financial assets derecognised or repaid (excluding write-offs)
(12,203)
-
-
(12,203)
Foreign exchange adjustments
-
-
-
-
As at 31 December 2022
24,155
-
-
24,155
Placements with Central Banks and Other Banks
24
Provision for impairment (ECL) as at 1 January 2022
533
-
-
533
Transfer to Stage 1
-
-
-
-
Transfer to Stage 2
-
-
-
-
Transfer to Stage 3
-
-
-
-
New remeasurement of impairment
-
-
-
-
New assets originated or purchased
319,949
-
-
319,949
Financial assets derecognised or repaid (excluding write-offs)
(533)
-
-
(533)
Foreign exchange adjustments
-
-
-
-
As at 31 December 2022
319,949
-
-
319,949
Financial assets at amortised cost - Loans and advances to other
customers
28
Provision for impairment (ECL) as at 1 January 2022
24,417,936
15,122,165
123,365,781
162,905,882
Transfer to Stage 1
6,023,202
(4,673,336)
(1,349,866)
-
Transfer to Stage 2
(2,841,625)
5,881,560
(3,039,935)
-
Transfer to Stage 3
(412,354)
(527,834)
940,188
-
Net remeasurement of impairment
8,018,739
8,225,065
55,108,662
71,352,466
New assets originated or purchased
4,347,529
1,439,471
1,379,826
7,166,826
Write-offs and recoveries
-
-
(18,554)
(18,554)
Foreign exchange adjustments
347,791
687,473
24,289,327
25,324,591
Interest accrued on impaired loans and advances
-
-
(7,758,610)
(7,758,610)
Other movements
(190,269)
(735,011)
1,137,317
212,037
As at 31 December 2022
39,710,949
25,419,553
194,054,137
259,184,639
Financial assets at amortised cost - Debt and other financial instruments
29
Provision for impairment (ECL) as at 1 January 2022
13,770,767
-
28,314
13,799,081
Transfer to Stage 1
-
-
-
-
Transfer to Stage 2
(13,607,594)
13,607,594
-
-
Transfer to Stage 3
-
-
-
-
Net remeasurement of impairment
160,903
15,902,905
-
16,063,808
New assets originated or purchased
-
-
-
-
Financial assets derecognised or repaid (excluding write-offs)
(162)
-
-
(162)
Foreign exchange adjustments
23,951,328
-
23,951,328
As at 31 December 2022
323,914
53,461,827
28,314
53,814,055

64.2.4 Analysis of risk concentration
Concentration risk in credit portfolios arises due to an uneven distribution of bank loans to individual borrowers, industry ,sector or
geographical regions. In managing the concentraion risk the Bank uses the Herfindahl-Harischman Index (HHI) as a measurement tool.
The Bank has established appropriate limits to maintain concentration risk at an acceptable level.
64.2.5
Country wise exposure
The Bank has established branches in three countries i.e. India, Maldives, and Seychelles through which the Bank mainly maintains
exposures outside Sri Lanka. Bank also has a fully owned subsidiary operating in United Kingdom (UK). All overseas branches are
operating with pre-set limits (credit limits as well as country limits) which are approved by the Board of Directors.
Exposures in other countries include placements with banks and nostro account balances with correspondent banks whose risks are
managed through Board approved limits.
31 December 2023
Sri Lanka
UK
Maldives
India
USA
Seychelles
Other
Countries
Total
LKR '000
LKR '000
LKR '000
LKR '000
LKR '000
LKR '000
LKR '000
LKR '000
Assets
Cash and cash equivalents
60,284,723
30,595,998
2,147,081
6,859,819
13,973,358
91,743
21,597,783
135,550,505
Balances with Central
Banks
25,082,652
-
8,712,214
469,290
-
668,483
-
34,932,639
Placements with banks
2,381,597
40,805,172
-
6,494,836
-
-
25,284,566
74,966,171
Securities purchased under
resale agreements
3,711,918
-
-
-
-
-
-
3,711,918
Derivative financial
instruments
20,525,840
-
-
-
-
-
-
20,525,840
Financial assets recognised
through profit or loss
measured at fair value
40,642,530
-
-
-
-
-
-
40,642,530
Financial assets at
amortised cost - loans and
advances
2,126,340,541
-
65,666,804
14,311,820
-
2,742,759
-
2,209,061,924
Financial assets at
amortised cost - debt and
other instruments
1,614,976,373
-
38,752,030
-
-
-
- 1,653,728,403
Financial assets measured
at fair value through OCI
46,667,389
-
-
2,866,609
-
-
-
49,533,998
Total financial assets
3,940,613,563
71,401,170
115,278,129
31,002,374
13,973,358
3,502,985
46,882,349
4,222,653,928
Liabilities
Due to banks
2,144,957
-
-
902,775
-
-
-
3,047,732
Securities sold under
repurchase agreements
78,463,070
-
-
-
-
-
-
78,463,070
Derivative financial
instruments
2,169,202
-
-
-
-
-
-
2,169,202
Financial liabilities at
amortised cost - due to
depositors
3,793,794,162
-
72,713,120
10,842,633
-
4,882,408
- 3,882,232,323
Financial liabilities at
amortised cost - other
borrowings
7,676,862
-
-
-
-
-
25,989,374
33,666,236
Subordinated liabilities
64,691,810
-
-
-
-
-
-
64,691,810
Total financial liabilities
3,948,940,063
-
72,713,120
11,745,408
-
4,882,408
25,989,374
4,064,270,373

31 December 2022
Sri Lanka
UK
Maldives
India
USA
Seychelles
Other
Countries
Total
LKR '000
LKR '000
LKR '000
LKR '000
LKR '000
LKR '000
LKR '000
LKR '000
Assets
Cash and cash equivalents
57,132,066
30,944,706
1,672,605
949,436
28,935,856
95,207
8,671,656
128,401,532
Balances with Central
Banks
63,270,481
-
5,932,746
638,905
-
652,397
-
70,494,529
Placements with banks
374,276
15,865,662
-
219,365
-
-
-
16,459,303
Securities purchased under
resale agreements
1,480,403
-
-
-
-
-
-
1,480,403
Derivative financial
instruments
57,155,486
-
-
-
-
-
-
57,155,486
Financial assets recognised
through profit or loss/ Held
for trading - measured at
fair value
10,280,055
-
-
-
-
-
-
10,280,055
Financial assets at
amortised cost - loans and
advances
2,242,060,794
-
64,041,702
16,741,956
-
2,749,877
- 2,325,594,329
Financial assets at
amortised cost - debt and
other instruments
1,511,726,174
-
44,171,133
-
-
-
- 1,555,897,307
Financial assets measured
at fair value through OCI/
Available for sale
5,656,098
-
-
3,034,704
-
-
-
8,690,802
Total financial assets
3,949,135,833
46,810,368
115,818,186
21,584,366
28,935,856
3,497,481
8,671,656
4,174,453,746
Liabilities
Due to banks
189,126
1,493,406
-
1,438,081
8,289,350
-
104,934
11,514,897
Securities sold under
repurchase agreements
180,218,543
-
-
-
-
-
-
180,218,543
Derivative financial
instruments
921,033
-
-
-
-
-
-
921,033
Financial liabilities at
amortised cost - due to
depositors
3,231,785,180
-
86,213,418
12,802,183
-
3,973,480
- 3,334,774,261
Financial liabilities at
amortised cost - other
borrowings
306,563,900
-
-
-
-
-
390,489,543
83,925,643
Subordinated liabilities
63,758,191
-
-
-
-
-
-
63,758,191
Total financial liabilities
3,783,435,973
1,493,406
86,213,418
14,240,264
8,289,350
3,973,480
84,030,577
3,981,676,468

The Bank’s portfolio is well diversified with in the sectors and all exposures were maintained within the set HHI during the year.
64.2.6 Sector wise exposure
31 December 2023
Agriculture
and fisheries
Banking
finance and
insurance
Hotels travels
and services
LKR ‘000
LKR ‘000
LKR ‘000
Cash and cash equivalents
-
135,613,096
-
Less : Impairment
-
-
-
Balances with Central Banks
-
25,082,652
-
Placements with banks
-
75,010,950
-
Less : Impairment
-
-
-
Securities purchased under resale agreements
-
3,711,918
-
Derivative financial instruments
-
20,525,840
-
Financial assets recognised through profit or loss/ Held for trading - measured
at fair value
328,790
56,791
374,801
Financial assets at amortised cost - loans and advances
232,974,575
29,846,791
143,495,238
Less : Impairment
-
-
-
Financial assets at amortised cost - debt and other instruments
12,438
1,378,399
-
Less : Impairment
-
-
-
Financial assets measured at fair value through OCI
-
3,112,110
-
Total financial assets
233,315,803
294,338,547
143,870,039
31 December 2022
Agriculture
and fisheries
Banking
finance and
insurance
Hotels travels
and services
LKR ‘000
LKR ‘000
LKR ‘000
Cash and cash equivalents
-
128,425,687
-
Less : Impairment
-
-
-
Balances with Central Banks
-
63,270,482
-
Placements with banks
-
16,779,252
-
Less : Impairment
-
-
-
Securities purchased under resale agreements
-
1,480,403
-
Derivative financial instruments
-
57,155,486
-
Financial assets recognised through profit or loss -measured at fair value
337,108
28,777
312,240
Financial assets at amortised cost - loans and advances
186,702,488
41,494,798
152,048,154
Less : Impairment
-
-
-
Financial assets at amortised cost - debt and other instruments
19,302
1,819,382
-
Less : Impairment
-
-
-
Financial assets measured at fair value through OCI
-
1,705,544
-
Total financial assets
187,058,898
312,659,811
152,360,394

The Bank’s portfolio is well diversified with in the sectors and all exposures were maintained within the set HHI during the year.
64.2.6 Sector wise exposure
31 December 2023
Agriculture
and fisheries
Banking
finance and
insurance
Hotels travels
and services
Housing,
construction
and
infrastructure
Manu-
facturing
Commercial
trade
Sovereign
and direct
government
Transportation
and
logistics
Other
commercial
services
Consumption
and
others
Total
LKR ‘000
LKR ‘000
LKR ‘000
LKR ‘000
LKR ‘000
LKR ‘000
LKR ‘000
LKR ‘000
LKR ‘000
LKR ‘000
LKR ‘000
Cash and cash equivalents
-
135,613,096
-
-
-
-
-
-
-
-
135,613,096
Less : Impairment
-
-
-
-
-
-
-
-
-
-
(62,591)
Balances with Central Banks
-
25,082,652
-
-
-
-
-
-
9,849,987
-
34,932,639
Placements with banks
-
75,010,950
-
-
-
-
-
-
-
-
75,010,950
Less : Impairment
-
-
-
-
-
-
-
-
-
-
(44,779)
Securities purchased under resale agreements
-
3,711,918
-
-
-
-
-
-
-
-
3,711,918
Derivative financial instruments
-
20,525,840
-
-
-
-
-
-
-
-
20,525,840
Financial assets recognised through profit or loss/ Held for trading - measured
at fair value
328,790
56,791
374,801
219,266
961,919
14,367
34,044,786
87,719
83,406
4,470,685
40,642,530
Financial assets at amortised cost - loans and advances
232,974,575
29,846,791
143,495,238
498,658,607
158,674,002
726,191,065
45,680,773
88,945,112
94,756,303
438,549,272
2,457,771,739
Less : Impairment
-
-
-
-
-
-
-
-
-
- (248,709,815)
Financial assets at amortised cost - debt and other instruments
12,438
1,378,399
-
-
-
741,199
1,699,825,287
-
-
- 1,701,957,323
Less : Impairment
-
-
-
-
-
-
-
-
-
-
(48,228,920)
Financial assets measured at fair value through OCI
-
3,112,110
-
-
-
-
42,437,930
-
3,983,958
-
49,533,998
Total financial assets
233,315,803
294,338,547
143,870,039
498,877,873
159,635,921
726,946,631
1,821,988,776
89,032,831
108,673,654
443,019,957
4,222,653,927
31 December 2022
Agriculture
and fisheries
Banking
finance and
insurance
Hotels travels
and services
Housing,
construction
and
infrastructure
Manu-
facturing
Commercial
trade
Sovereign
and direct
government
Transportation
and
logistics
Other
commercial
services
Consumption
and
others
Total
LKR ‘000
LKR ‘000
LKR ‘000
LKR ‘000
LKR ‘000
LKR ‘000
LKR ‘000
LKR ‘000
LKR ‘000
LKR ‘000
LKR ‘000
Cash and cash equivalents
-
128,425,687
-
-
-
-
-
-
-
-
128,425,687
Less : Impairment
-
-
-
-
-
-
-
-
-
-
(24,155)
Balances with Central Banks
-
63,270,482
-
-
-
-
-
-
7,224,047
-
70,494,529
Placements with banks
-
16,779,252
-
-
-
-
-
-
-
-
16,779,252
Less : Impairment
-
-
-
-
-
-
-
-
-
-
(319,949)
Securities purchased under resale agreements
-
1,480,403
-
-
-
-
-
-
-
-
1,480,403
Derivative financial instruments
-
57,155,486
-
-
-
-
-
-
-
-
57,155,486
Financial assets recognised through profit or loss -measured at fair value
337,108
28,777
312,240
14,271
1,432,628
14,552
3,867,685
111,601
92,487
4,068,706
10,280,055
Financial assets at amortised cost - loans and advances
186,702,488
41,494,798
152,048,154
560,794,607
164,211,886
740,998,278
131,865,400
95,757,779
15,858,272
495,047,305
2,584,778,967
Less : Impairment
-
-
-
-
-
-
-
-
-
- (259,184,638)
Financial assets at amortised cost - debt and other instruments
19,302
1,819,382
-
-
-
1,588,948
1,606,283,730
-
-
- 1,609,711,362
Less : Impairment
-
-
-
-
-
-
-
-
-
-
(53,814,055)
Financial assets measured at fair value through OCI
-
1,705,544
-
-
-
-
3,361,266
-
3,623,992
-
8,690,802
Total financial assets
187,058,898
312,659,811
152,360,394
560,808,878
165,644,514
742,601,778
1,745,378,081
95,869,380
26,798,798
499,116,011
4,174,453,746

64.2.7 Commitments and guarantees
The Bank enters into various irrevocable commitments and contingent liabilities to meet the financial needs of customers. They do
contain credit/default risk even though these obligations are not recognised in the statement of financial position as on balance sheet
assets. The capital charges for such commitments and contingent liabilities based on the applicable credit conversion factors are
allocated according to the regulatory guidelines to factor the risk inherent in it.
The table below shows the Bank’s maximum exposure for commitments and guarantees. The details of the Bank's credit risk exposure
for commitments and contingencies are disclosed in Note No.57.
Bank
As at 31 December
2023
2022
LKR ‘000
LKR ‘000
Acceptances and documentary credit
168,992,212
157,948,135
Bills for collection
58,195,110
64,815,618
Forward exchange contracts
393,201,966
199,453,327
Guarantees
164,216,780
167,974,583
Other commitments
131,208,997
56,983,452
915,815,065
647,175,115
64.2.8 Management overlays over Expected Credit Risk
Beyond the Bank’s normal impairment calculation process adopted for the loans and advances as per the SLFRS 9 and CBSL
Directions, the Bank considered the impacted industries from the continued adverse economic conditions since the pandemic.
Accordingly the management overlays were applied for tourism, construction and textile export sectors as risk elevated industries
and customers coming into stage 1 for those industries were transferred to stage 2 when assessing the impairment considering the
life time expected loss rather than 12 months expected loss under stage 1. Further, Bank continued to make additional provision for
credit facilities which are converted to new loans under various moratorium and concession schemes considering the potential risk.
In order to capture the prevailing economic conditions into Economic Factor Adjustment (EFA) to incorporate the expected credit
loss in determining the impairment for collectively assessed portfolios, on a prudent basis the Bank continued to use increased the
weightages applied for the expected economic scenarios as follows;
Economic Scenario
Weightages
2023 %
Best
10
Base
20
Worst
70
64.3 Liquidity risk
Liquidity is dynamic and can change according to both expected and unexpected business and market conditions. Liquidity risk arises
when the Bank encounters difficulties in meeting payment obligations timely in a cost effective way or finds it difficult to sell its assets
within appropriate amount of time at desirable price. The Bank maintains diversified funding sources in addition to its deposit base while
monitoring and managing future commitments daily basis to ensure effective liquidity management. The Central Bank's (CBSL) repo
window is one of the main sources of funding during the liquidity stress situation. The Bank's risk management framework plays vital role to
monitor that payment obligations of the Bank are made in a timely and efficient manner. In addition, liqudity risk management framework
includes compliance with the regulatory requirements, optimum usage of liquid assets for higher returns and funding business expansion.
The Bank maintains liqudity ratios well within the limits specified by the regulator to ensure healthy liquidity position.

64.3.1 Liquidity risk exposure
The key liquidity measurement tool used by the Bank is the liquid asset ratio which is one of the main regulatory liquidity
measurement devices. Cash, cash equivalents and investment in government securities are the main liquid assets which Bank
carefully manages to get an optimum return while maintaing healthy liquidity levels. In addition, liquidity position is assessed in
normal and stress scenarios relating to Bank specific, market specific and combined conditions to ensure its management at any
circumstances.
Total Bank
Off shore Banking Division
2023 (%)
2022 (%)
2023 (%)
2022 (%)
31 December
45.12
21.22
54.20
32.79
Average for the year
35.99
23.37
48.15
27.64
Regulatory minimum requirement
20.00
20.00
20.00
20.00
64.3.2 Maturity analysis of financial assets and liabilities
64.3.2.1 Non derivative financial assets and financial liabilities expected to be recovered or settled after 12 months from
the reporting date
The table below depicts the carrying amount of non derivative financial assets and financial liabilities expected to be recovered or
settled after 12 months from the settlement date.
Bank
As at 31 December
2023
2022
LKR ‘000
LKR ‘000
Financial assets
Non-derivative financial assets
Financial assets measured at fair value through profit or loss
4,435,342
4,483,675
Financial assets measured at amortised cost - loans and advances
1,185,512,161
1,246,524,775
Financial assets measured at amortised cost - debt instruments
987,694,007
1,111,684,272
Financial assets measured at fair value through OCI
18,996,459
6,322,150
Total non-derivative financial assets
2,196,637,969
2,369,014,872
Financial liabilities
Non-derivative financial liabilities
Financial liabilities at amortised cost - due to depositors
253,050,308
248,014,772
Financial liabilities at amortised cost - other borrowings
25,989,374
58,196,922
Subordinated liabilities
55,049,327
53,372,602
Total non-derivative financial liabilities
334,089,009
359,584,296

64.3.2.2 Undiscounted cashflow of financial liabilities
The table below presents the undiscounted maturity of the bank’s financial liabilities as at 31st December 2023.
31 December 2023
On demand
Less than
3 months
3 to
12 months
1 to
5 years
Over
5 years
Total
LKR '000
LKR '000
LKR '000
LKR '000
LKR '000
LKR '000
Due to banks
3,047,732
-
-
-
3,047,732
Securities Sold Under Repurchase
Agreements
-
74,593,102
4,449,127
-
-
79,042,229
Derivative financial instruments
-
2,169,202
-
-
-
2,169,202
Financial liabilities at amortised cost -
due to depositors
778,990,277
1,571,774,683
829,013,746
103,630,782
684,528,079
3,967,937,567
Financial liabilities at amortised cost -
other borrowings
-
7,676,861
-
26,725,999
-
34,402,860
Subordinated debentures
-
-
10,244,531
41,896,390
36,589,092
88,730,013
Total
782,038,009
1,656,213,848
843,707,404
172,253,171
721,117,171
4,175,329,603
31 December 2022
On demand
Less than
3 months
3 to
12 months
1 to
5 years
Over
5 years
Total
LKR '000
LKR '000
LKR '000
LKR '000
LKR '000
LKR '000
Due to banks
11,514,897
-
-
-
-
11,514,897
Securities Sold Under Repurchase
Agreements
-
184,677,045
-
-
-
184,677,045
Derivative financial instruments
-
921,033
-
-
-
921,033
Financial liabilities at amortised cost -
due to depositors
989,255,381
1,263,861,028
859,092,295
317,787,701
3,576,984
3,433,573,389
Financial liabilities at amortised cost -
other borrowings
303,945,327
25,820,523
2,657,748
59,452,683
-
391,876,281
Subordinated debentures
11,465,533
56,040,654
19,549,885
87,056,072
Total
1,304,715,605
1,475,279,629
873,215,576
433,281,038
23,126,869
4,109,618,717
64.4 Market Risk
Market risk is the risk of loss arrising due to unfavourable movements in market variables such as interest rates, foreign exchange
rates, equity prices and commodity prices. Exposure to the market risk arises mainly from Interest Rate Risk (IRR) and Foreign
Exchange (FX) risks. Exposure to commodity related risk is insignificant as it is limited to the extent of the fluctuation of the price of
the Bank's gold stock.
The Bank classifies exposures into either trading or non-trading portfolios and manages each of these portfolios separately. The
market risk for the foreign exchange and equity trading portfolios are managed and monitored based on a Value at Risk (VaR)
methodology. In addition to the Net Open Position (NOP) limit of managing foreign exchange risk and holding period limit to
manage the equity risk. Interest rate risk of the trading portfolio is managed through Price Value per Basis Point (PVBP) and modified
duration. In addition trading and non trading portfolios are managed through risk monitoring, risk assessment, sensitivity analysis and
stress testing. Interest Rate Risk in Banking Book (IRRBB) is monitored through sensitivity analysis.

64.4.1 Trading and non-trading portfolio - Bank
The table below sets out the allocation of assets and liabilities subject to market risk between trading and non-trading portfolios
As at 31 December 2023
Note
Carrying
amount
Market risk measurement
Trading
portfolios
Non-trading
portfolios
LKR '000
LKR '000
LKR '000
Assets subject to market risk
Cash and cash equivalents
22
135,550,505
-
135,550,505
Balances with Central Banks
23
34,932,639
-
34,932,639
Placements with banks
24
74,966,171
-
74,966,171
Securities purchased under resale agreements
25
3,711,918
-
3,711,918
Derivative financial instruments
26
20,525,840
20,525,840
-
Financial assets recognised through profit or loss
- measured at fair value
27
40,642,530
40,642,530
-
Financial assets at amortised cost
- loans and advances
28
2,209,061,924
- 2,209,061,924
- debt and other instruments
29
1,653,728,403
- 1,653,728,403
Financial assets measured at fair value through OCI
30
49,533,998
-
49,533,998
Investment in subsidiary companies
31
8,181,138
-
8,181,138
Investment in associate companies
32
92,988
-
92,988
Investment properties
33
2,414,640
-
2,414,640
Property, Plant and Equipment
34
42,564,498
-
42,564,498
Right of Use Assets/ Leasehold properties
35
3,508,618
-
3,508,618
Intangible assets
36
1,554,875
-
1,554,875
Deferred tax assets
37
18,503,397
-
18,503,397
Other assets
38
112,274,233
-
112,274,233
Total assets
4,411,748,315
61,168,370
4,350,579,945
Liabilities subject to market risk
Due to banks
39
3,047,732
-
3,047,732
Securities sold under repurchase agreements
40
78,463,070
-
78,463,070
Derivative financial instruments
41
2,169,202
2,169,202
-
Financial liabilities at amortised cost
- due to depositors
42
3,882,232,323
- 3,882,232,323
- other borrowings
43
33,666,236
-
33,666,236
Current tax liabilities
45
7,621,675
-
7,621,675
Other liabilities
47
88,141,547
-
88,141,547
Subordinated liabilities
49
64,691,810
-
64,691,810
Total liabilities
4,160,033,595
2,169,202
4,157,864,393

As at 31 December 2022
Note
Carrying
amount
Market risk measurement
Trading
portfolios
Non-trading
portfolios
LKR '000
LKR '000
LKR '000
Assets subject to market risk
Cash and cash equivalents
22
128,401,532
-
128,401,532
Balances with Central Banks
23
70,494,529
-
70,494,529
Placements with banks
24
16,459,303
-
16,459,303
Securities purchased under resale agreements
25
1,480,403
-
1,480,403
Derivative financial instruments
26
57,155,486
57,155,486
-
Financial assets recognised through profit or loss
- measured at fair value
27
10,280,055
10,280,055
-
Financial assets at amortised cost
- loans and advances
28
2,325,594,329
- 2,325,594,329
- debt and other instruments
29
1,555,897,307
- 1,555,897,307
Financial assets measured at fair value through OCI
30
8,690,802
-
8,690,802
Investment in subsidiary companies
31
8,181,138
-
8,181,138
Investment in associate companies
32
92,988
-
92,988
Investment properties
33
2,414,640
-
2,414,640
Property, Plant and Equipment
34
34,845,004
-
34,845,004
Right of Use Assets/ Leasehold properties
35
3,002,305
-
3,002,305
Intangible assets
36
1,442,433
-
1,442,433
Deferred tax assets
37
15,577,466
-
15,577,466
Other assets
38
96,449,984
-
96,449,984
Total assets
4,336,459,704
67,435,541
4,269,024,163
Liabilities subject to market risk
Due to banks
39
11,514,897
-
11,514,897
Securities sold under repurchase agreements
40
180,218,543
-
180,218,543
Derivative financial instruments
41
921,033
921,033
-
Financial liabilities at amortised cost
- due to depositors
42
3,334,774,261
- 3,334,774,261
- other borrowings
43
390,489,543
-
390,489,543
Current tax liabilities
45
6,523,443
-
6,523,443
Other liabilities
47
94,075,650
-
94,075,650
Subordinated liabilities
49
63,758,191
-
63,758,191
Total liabilities
4,082,275,561
921,033
4,081,354,528

64.4.2 Interest rate risk
Interest rate risk is the probability of decline in value of an asset resulting from unexpected fluctuations in interest rates. Interest rate
risk affects to the Bank's earnings and impacts negatively on Net Interest Income (NII) of the Bank. Continous monitoring and periodic
repricing strategies ensures the interest rate risk is managed effectively.
Price Value per Basis Point (PVBP) and duration analysis are monitored against the risk appetite limits on daily basis in order to assess
the impact of interest rate changes on Bank’s trading portfolios of Treasury bills and bonds which are rate sensitive instruments.
2023
LKR
2022
LKR
Risk appetite
PVBP
Investment in T-Bills
32,444
3,088
900,000
Investment in T-Bonds
577,985
75,767
2,100,000
Sensitivity analysis of interest sensitive assets and liabilities is carried out to monitor interest rate risk in the banking book by placing
those assets and liabilities in pre-determined maturity buckets considering its residual time to maturity and setting and monitoring
gap limits and the repricing profile. The table below analyses the Bank's interest rate risk exposure as a percentage on financial assets
and liabilities.
2023
Upto 1
Month (%)
1-3
Months (%)
3-6
Months (%)
6-12
Month (%)
1-2
Years (%)
2-3
Years (%)
3-4
Years (%)
4-5
Years (%)
Over 5
Years (%)
Rate sensitive assets
9.7
14.9
12.6
12.1
6.2
6.2
5.9
5.9
26.6
Rate sensitive liabilities
10.2
13.9
14.7
14.2
5.1
5.1
5.4
5.4
26.0
GAP
(0.5)
1.0
(2.1)
(2.1)
1.1
1.1
0.5
0.5
0.7
2022
Upto 1
Month (%)
1-3
Months (%)
3-6
Months (%)
6-12
Months (%)
1-2
Years (%)
2-3
Years (%)
3-4
Years (%)
4-5
Years (%)
Over 5
Years (%)
Rate sensitive assets
13.0
12.6
5.9
7.9
10.2
17.0
6.3
5.2
22.0
Rate sensitive liabilities
16.2
17.2
12.2
15.7
3.9
3.9
3.4
3.4
24.2
GAP
(3.2)
(4.7)
(6.4)
(7.8)
6.3
13.2
2.9
1.8
(2.2)
64.4.3
Foreign exchange risk
Currency risk is the risk of adverse fluctuation of value of foreign currency denominated financial instruments due to changes in
foreign exchange rates which affects the financial performance or financial position of the Bank. The Bank carried open positions
during the year which is within the limits approved by the Central Bank of Sri Lanka. A comprehensive Limit Management Framework
(LMF) including individual exposures and aggregated exposures prescribed by the IRMC govern the foreign exchange risk. Stress
testing analysis carried out on foreign exchange transactions to assess the impact to profit and Capital Adequacy Ratio (CAR) during
stress situations.

Foreign Exchange Position as at 31 December
2023
2022
Net
Overall Long
Net
Overall Short
Net
Overall Long
Net
Overall Short
LKR '000
LKR '000
LKR '000
LKR '000
Currency
United States Dollar
6,195,839
-
1,220,240
-
Great Britain Pound
12,550
-
29,415
-
Euro
-
(54,227)
340,914
-
Japanese Yen
1,061,958
-
-
(819)
Australian Dollar
4,261
-
2,279
-
Canadian Dollar
-
(21,098)
1,203
-
Swiss Franc
-
-
896
-
Singapore Dollar
1,399
-
14,808
-
Hong Kong Dollar
174,491
-
6,905
-
Sub Total
7,450,498
(75,325)
1,616,660
(819)
Other Currencies
7,958,248
(116,391)
13,220,700
(1,795,396)
Grand Total
15,408,746
(191,716)
14,837,360
(1,796,215)
Higher of Long or Short
15,408,746
14,837,360
Impact on Income Statement due to Exchange Rate Shocks
2023
2022
Net Open
Position
(After Rate
Shocks)
LKR '000
Impact
on Income
Statement
as at 31st
December
2023
LKR '000
Net Open
Position
(After Rate
Shocks)
LKR '000
Impact
on Income
Statement
as at 31st
December
2022
LKR '000
Exchange Rate Shocks
5%
14,638,308
(770,437)
14,095,492
(741,868)
10%
13,867,871
(1,540,875)
13,353,624
(1,483,736)
-5%
16,179,183
770,437
15,579,228
741,868
-10%
16,949,620
1,540,875
16,321,096
1,483,736
64.4.4
Equity Risk
Equity risk is the risk of deteriorating fair value of equity portfolio due to a change in the level of equity indices and price of individual
stocks. Equity risk is monitored by stipulating overall portfolio limits, dealer limits, loss limits and use of VaR methodology.

64.5 Operational Risk
Operational risk is the risk of loss resulting from inadequate or failed internal processes, people and systems or from external events.
The Bank has allocated a significant amount of capital for operational risk as per the Basic Indicator Approach (BIA) despite the fact
that the actual operational losses are far below the allocated capital. The holistic and comprehensive operational risk management
framework of the Bank ensures that all relevant risks are proactively managed.
64.6 Capital Management
Capital is the financial cushion against the risks assumed by the Bank. Proper capital management is therefore, vital in ensuring the
sustainability and long term stability of the business.The primary objective of capital management is the maintenance of capital
levels above the minimum regulatory requirement and optimum capital usage for maximum profitability. Given the size and the
nature of the business, retained earnings is the primary source of internal capital generation of the Bank. Capital augmentation plan
determines the alternative sources of capital to ensure the achievement of pre-determined capital targets for business expansion and
to accommodate stress scenarios.
64.6.1 Capital adequacy and Internal Capital Adequacy Assessment Process (ICAAP)
The capital adequacy is a measure of the financial strength of the Bank expressed as a ratio of its capital to Risk Weighted Assets
(RWAs) of credit, market and operational aspects of the business. This ratio indicates the Bank's ability to maintain adequate capital
to ensure financial soundness which ascertain how effectively it can sustain a reasonable level of risk.The minimum total capital
requirement for Domestic Systemically Important Banks (DSIBs) is 14% and requires Bank to maintain Tier I capital level of 10%.
Internal Capital Adeqacy Assessment Process (ICAAP) determines the level of capital to be maintained against all risks inline with
the Basel requirement and guideline prescribed by the regulator. The capital planning is facilitated by the ICAAP based on the
accomplished and planned business process that ensures the sufficient capital levels are maintained to cover all the risks the Bank
exposed to. The Bank uses internal models which are internationally accepted to assess the pillar 2 risks in ICAAP and carries out
comprehensive stress testing using multiple scenarios to determine the total capital reqirement. ICAAP factors out all possible
qualitative risks such as reputation risk, compliance risk, strategic risk and IT risk etc. and assessment of concentration risk ensures
that the Bank has a well diversifed portfolio which is not excessively exposed to any counterpary, product, sector or a geographical
segment.
Capital levels
2023
2022
LKR ‘000
LKR ‘000
Capital charge for credit risk weighed assets
219,933,107
216,511,528
Capital charge for market risk weighed assets
2,857,769
2,763,445
Capital charge for operational risk weighed assets
21,570,870
21,422,430
Tier I capital (Regulatory minimum - 10%)
12.76
12.41
Total capital (Regulatory minimum - 14%)
15.84
15.38