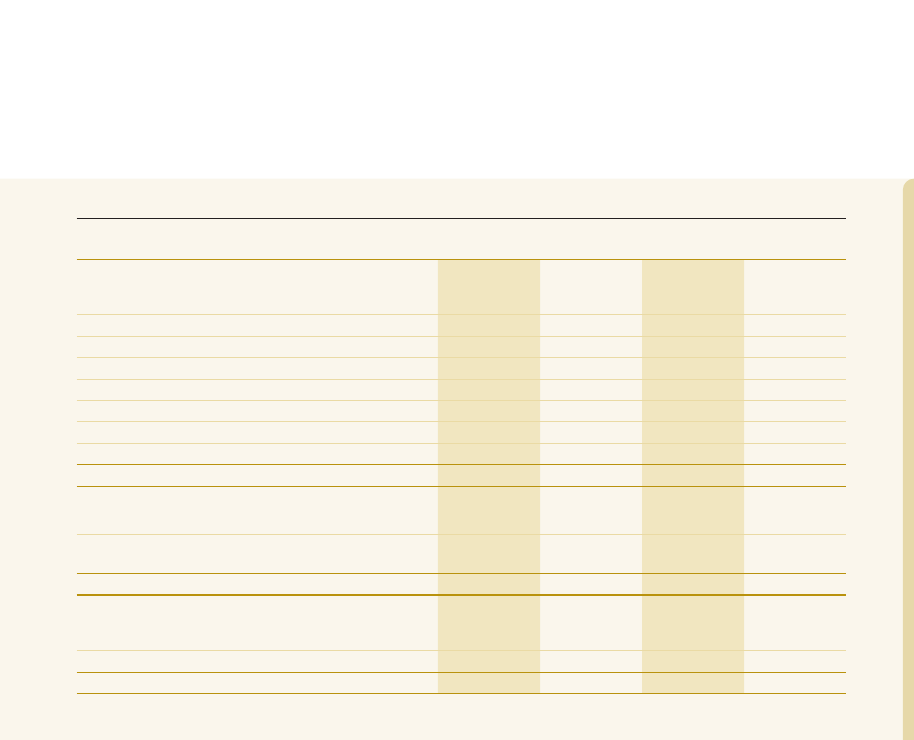
Bank
Group
For the year ended 31 December
Note
2023
2022
2023
2022
LKR ‘000
LKR ‘000
LKR ‘000
LKR ‘000
Cash flows from operating activities
Profit before income tax
40,342,423
30,976,649
41,773,025
31,052,501
Adjustments for:
Net interest income
8
(91,187,586)
(126,346,378)
(95,510,112)
(129,768,892)
Dividend income
10/13
(322,009)
(450,977)
(389,099)
(515,426)
Dividends from subsidiaries and associates
13
(372,900)
(107,430)
-
-
Share of (profits)/ losses of associate companies, net of tax 19
-
-
(33,507)
(122,847)
Change in operating assets
56.1
130,572,896
(392,658,229)
126,112,293
(389,853,461)
Change in operating liabilities
56.2
106,210,544
510,080,706
108,724,603
517,045,767
Other non-cash items included in profit before tax
56.3
15,602,055
105,190,513
15,942,446
105,731,706
Other net (gains)/ losses from investing activities
(2,220,585)
(56,912)
(2,918,851)
72,145
198,624,838
126,627,942
193,700,798
133,641,493
Benefit paid from defined benefit plans
(12,851,008)
(11,204,969)
(12,858,497)
(11,275,993)
Interest received
287,270,252
289,089,403
292,995,798
295,198,149
Interest paid
(402,296,042)
(177,094,051)
(405,747,564)
(180,307,490)
Dividends received
83,926
73,282
96,176
73,282
Net cash from / (used in) operating activities
before income tax
70,831,966
227,491,607
68,186,711
237,329,441
Income tax paid
45
(12,124,580)
(5,500,380)
(12,604,215)
(5,796,331)
Surcharge tax paid
-
(6,738,542)
-
(7,042,422)
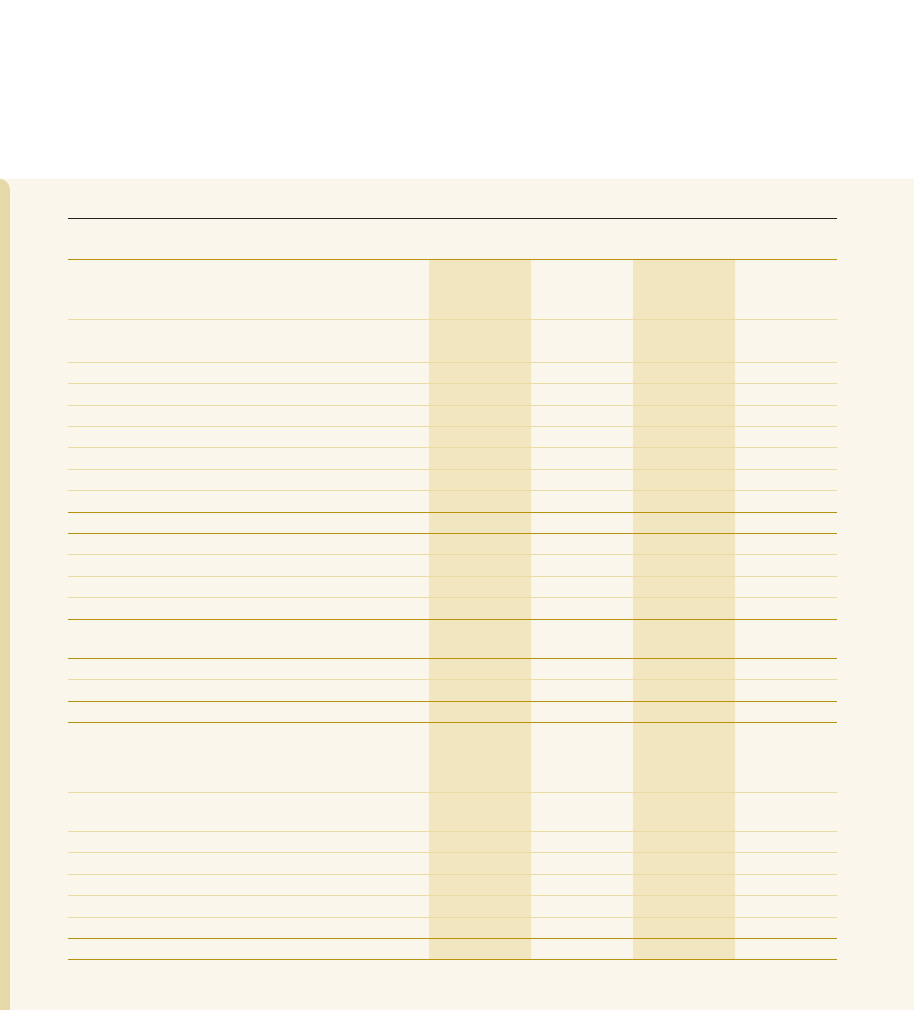
Net cash from / (used in) operating activities
58,707,386
215,252,685
55,582,496
224,490,688
Cash flows from investing activities
Net increase in financial investments at amortised
cost
(97,158,853)
(136,219,260)
(96,952,346)
(142,193,560)
Net increase in financial assets measured at fair
value through OCI
(38,256,489)
10,731,712
(39,468,843)
14,095,845
Purchase of property, plant and equipment
(3,177,730)
(2,243,640)
(3,578,110)
(2,301,746)
Purchase of intangible assets
(476,639)
(1,027,211)
(478,130)
(1,039,078)
Proceeds from sale of property, plant and equipment
60,688
1,414
96,196
8,748
Dividends received
610,983
485,126
292,923
448,891
Interest received
179,414,013
115,497,384
181,368,386
116,324,524
Net cash from/ (used in) investing activities
41,015,973
(12,774,475)
41,280,076
(14,656,376)
STATEMENT OF CASH FLOWS