Having faced two volatile and difficult years in 2021 and 2022, the Sri Lankan banking sector witnessed signs of improvement towards the latter part of 2023 as a result of the economic reform programmes implemented by the Government and CBSL.
•
Amidst economic fluctuations and changing market conditions, the sector went through a transformative phase, showcasing adaptability and fortitude.
•
A gradual increase in credit was witnessed towards the end of 2023 with the easing of policy rates by the CBSL along with a stabilisation of credit risk as indicated by the slowdown in the growth of Stage 3 loans.
10.6%
(2022: 14.1%)
Return on
equity
LKR 542.2
billion
(2022 : LKR 513.1 billion)
Revenue
LKR 40.3
billion
(2022 : LKR 31.0 billion)
Profit before tax
30%
(2022 : - 28%)
Profit before
tax growth
CONTEXT FOR 2023
Despite the challenging
market conditions, BoC
took stringent action to
ensure the stability of the
Bank was maintained, while
minimising negative impacts
on its stakeholders. As
‘Bankers to the Nation’ we
put in a major effort to revive
and stabilise the economy
through careful allocation
of our financial capital and
disciplined execution of our
strategies. Standing tall under
challenging macroeconomic
conditions, the Bank emerged
as a force of strength,
consistently delivering
positive financial results, and
ending the year with a profit
before tax of LKR 40.3 billion.
VALUE FOR
SHAREHOLDERS
STRATEGIC
PERFORMANCE
LKR 2.5
trillion
(2022 : LKR 2.6 trillion)
Gross loans and
advances
LKR 3.9
trillion
(2022 : LKR 3.3 trillion)
Deposits
12.8%
(2022 : 12.4%)
Tier 1 Capital ratio
316%
(2022 : 169%)
Liquidity
coverage ratio
5.1%
(2022 : 5.3%)
Stage 3 loans ratio
60.4%
(2022 : 59.7%)
Provision coverage
Stage 3
DEPOSITS AND LOANS
STABILITY,
GOVERNANCE
AND
SUSTAINABLE
GROWTH
Delivering a
sound financial
performance
Strengthening the
Financial Position
Shareholder value
creation
CAPITAL AND LIQUIDITY
RISK PROFILE
PRIORITY AREA 01:
DELIVERING A SOUND FINANCIAL
PERFORMANCE
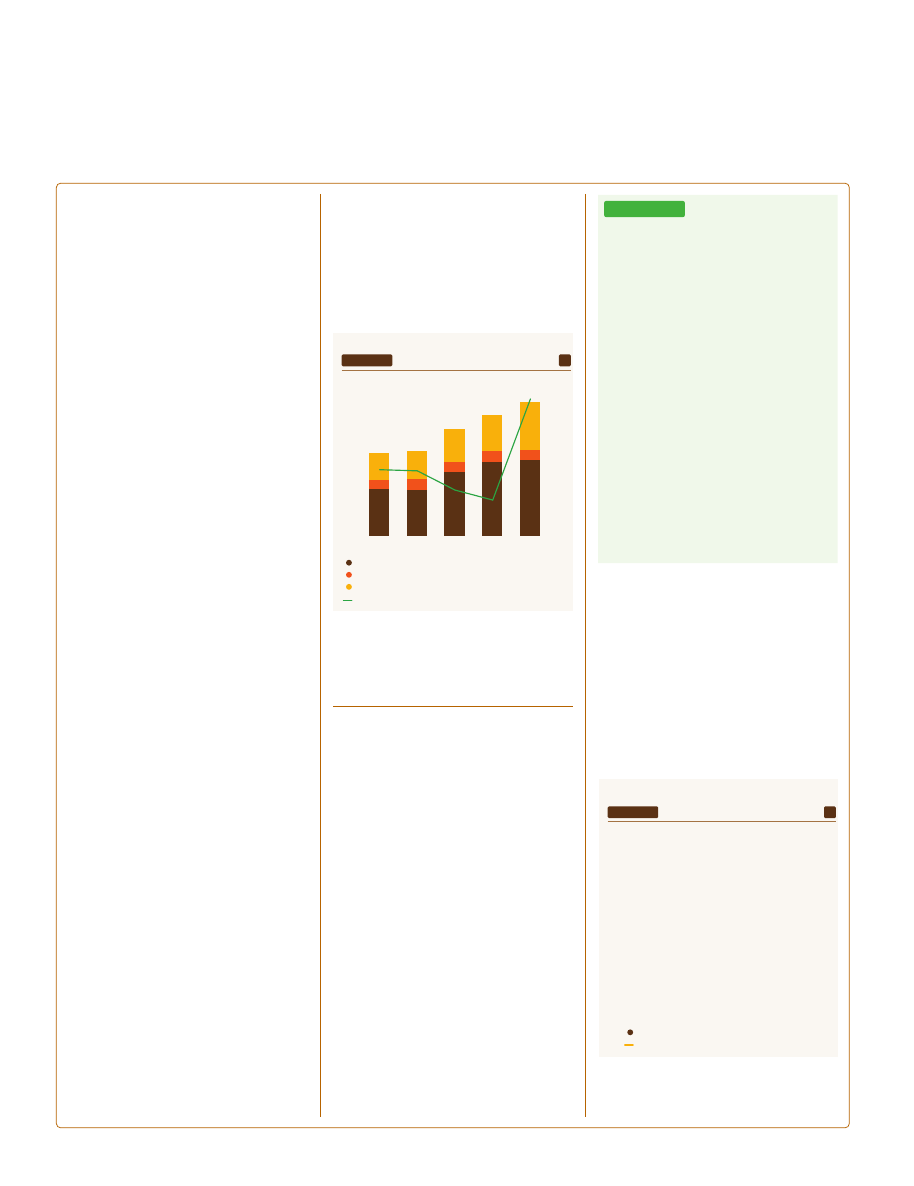
Net Interest Income (NII)
Interest income which accounts for 97% of the total income of the Bank marked a growth of 15%, recording LKR 524.8 billion for the year under review.
Interest income from loans and advances accounted for 64% of the total interest income of the Bank marking an 8% growth during the year. Low demand for the credit experienced during first half of the year negatively impacted interest income from loans and advances, which is further demonstrated by the drop in the credit to deposit ratio from 78% as of end 2022 to 63% as of end 2023.
TRENDS IN NET INTEREST INCOME
0
20
40
60
80
100
120
140
160
0.0
0.5
1.0
1.5
2.0
2.5
3.0
3.5
75.1
3.2
2.8
3.3
3.1
2.1
74.8
111.3
126.3
91.2
2019
2020
2021
2022
2023
Net interest income Net interest margin
%
LKR billion
Interest income from investments increased by 30% YoY as the Bank’s excess liquidity was invested in interest earning investment assets.
Interest expenses grew by 31% to LKR 433.6 billion during the year under review. Interest expenses for deposits which comprised of 87% of the total interest expenses grew by 63% YoY. However, as the Bank Strategically, managed the funding cost the borrowing cost of the Bank reduced by 43% to LKR 56.1 billion (2022: LKR 98.1 billion).
The growth in interest expense outpaced the growth in interest income, resulting in a net interest income of LKR 91.2
billion denoting a dip of 28% compared to the previous year. This contraction occurred mainly due to the lag effect of repricing fixed deposits mobilised at higher interest rates. Intense efforts were taken to safeguard customers from the adverse impact of the rate hikes. The Bank ensured that loans with variable interest rates were not fully adjusted in line with the increase in market rates and similarly loans with fixed interest rates not adjusted upwards as well. The Bank extended the benefits of interest rate rationalisation to customers, contributing to significant savings for businesses and households that were facing challenging conditions stemming from the economic crisis.
Fee Based Income gains/losses
Net fee and commission income experienced a growth of 8%, recording LKR 17.7 billion as at year end. This is primarily due to increased activity in card transactions and greater adoption of digital banking services in retail banking.
FEE BASED INCOME
0
5
10
15
20
25
30
14.6
14.3
17.6
22.8
11.9
14.2
16.3
25.9
17.6
12.1
2019
2020
2021
2022
2023
Fee and commission income Net fee and Commission income
%
LKR billion
In 2023, the credit card portfolio increased by LKR 2.1 billion accumulating to LKR 9.6 billion. Accordingly, credit and debit card fee income increased by LKR 2.8 billion resulting in an accumulated total fee income from cards of LKR 11.6 billion during the year. Representing 45% of the total fee income, this growth reflects the Bank’s continued drive for greater digitalisation.
Other Non Fund Based Income
Other non-fund based income were generated through;
•
the trading gains/ losses from foreign exchange, changes in fair value of derivative financial instruments, dividend income from trading equities.
•
Unrealised gains/losses from investments in equities and debt instruments classified at fair value through Profit or loss.
•
Net gains/ losses from derecognition of financial assets
•
Net other operating income derived from dividend income from subsidiaries,. gains/losses from foreign currency assets/liabilities revaluation to reporting currency, rent income, etc.
Net gains from trading activities and net other operating income negatively impacted to the non-fund based income mainly due to the LKR 12.7 billion exchange losses reported with the appreciation of LKR by 11% during the year (2023: LKR 323.9233, 2022: LKR 363.1100).
However, the investment in equities and unit trust resulted mark to market gains as the share market started to boom up after a notable decline reported from 2019 with Easter attack, COVID - 19 outbreak and economic unrest.
Fair value gain of LKR 858.7 million from financial instruments at fair value through profit/loss and LKR 1,361.9 million gain from derecognition of financial assets were recognised to Profit or Loss during the year.
Impairment Charges
IMPAIRMENT CHARGES
-25
0
25
50
75
100
0
5
10
15
18.6
31.2
43.7
87.2
(4.9)
6%
6%
6%
10%
10%
74.8
2019
2020
2021
2022
2023
Impairment Charge/ (Reversal) Impairment Provision as a % of Gross Loans
%
LKR billion
The Bank adopted a proactive and prudent approach to maintaining considerable impairment provisions under the Expected Credit Loss model over the years, and at the beginning of 2023, held a provision coverage of 60% for Stage 3 loans and same coverage was maintained at the year end too.
In 2023, the Bank recorded a net reversal of impairment provisions for loans and advances amounting to LKR 2.7 billion. This positive outcome was attributed to the synergy of various factors, including robust business revival activities, rigorous credit monitoring practices, and the favourable appreciation of the LKR against USD. The Bank continued its prudent policy of providing additional provisions against newly-identified customer segments with elevated credit risk during the reporting period.
Stage 3 loans and advances reduced by LKR 12.8 billion during the year as a result of the strategic measures taken by the Bank to revive troubled customers. Stage 2 loans increased by LKR 64.9 billion and provision for Stage 2 loans also increased by the LKR 3.4 billion. Using management overlays, risk elevated industries were identified, and total exposures of such sectors were classified under Stage 2.
Under the CBSL Direction No. 13 of 2021 Classification, Recognition and Measurement of Credit Facilities, Licensed Banks are required to maintain a minimum 0.5% coverage for Stage 1 loans and BoC has maintained a 1.7% coverage as of end 2023, which is well above the requirment.
The Bank recorded LKR 2.2 billion net reversal of impairment against other financial instruments during the reporting year. Under the Domestic Debt Optimisation (DDO) programme announced by the Government, the investments in Sri Lanka Development Bonds (SLDBs) were converted to LKR Treasury Bonds during the year. Accordingly, the accumulated provision maintained for SLDBs was reversed and fair value adjustments also accounted for recognition of LKR Bonds which were received on account of settlement of SLDBs.
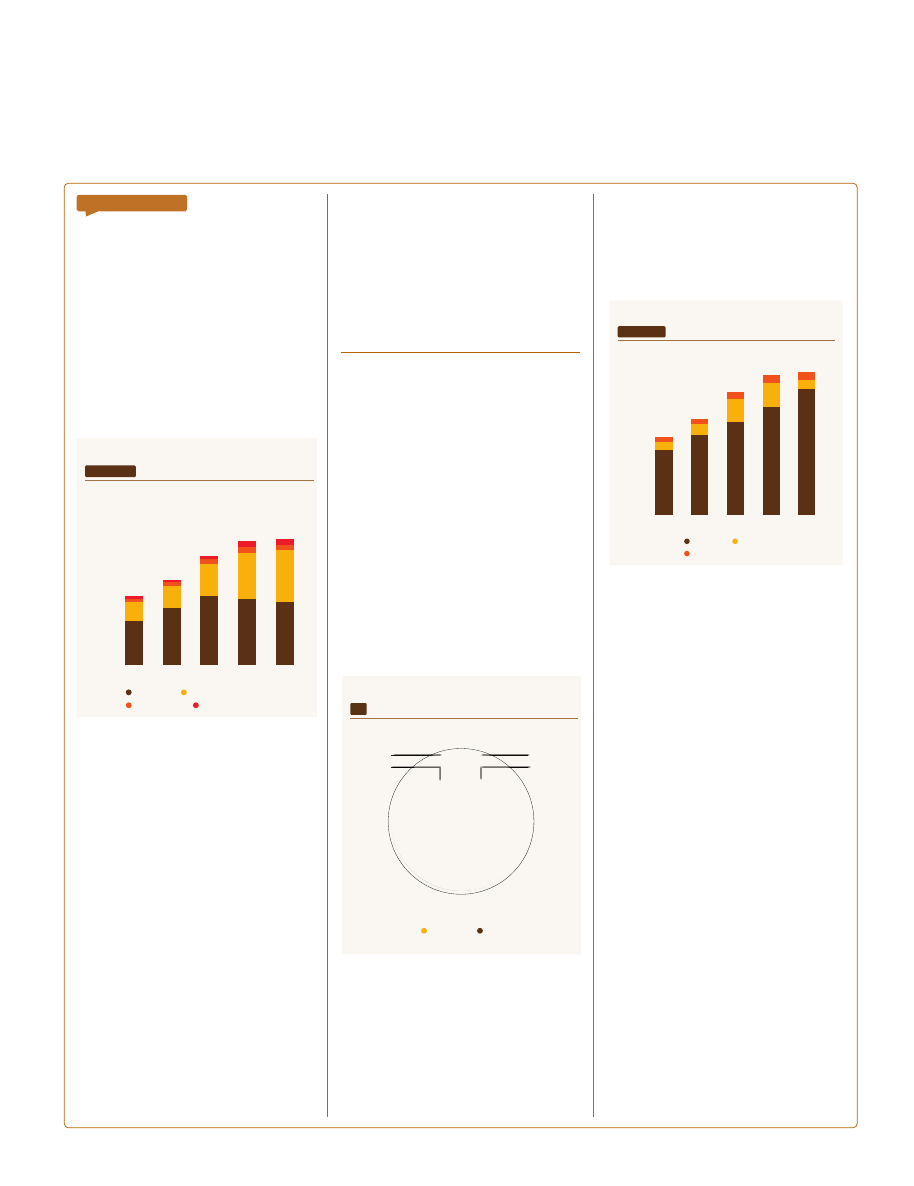
Total Operating Costs
Total operating expenses increased by 11%, primarily driven by escalating other administrative expenses in line with higher inflation and additional price adjustments influenced by LKR depreciation.
COST MANAGEMENT
0
10
20
30
40
50
60
20
30
40
50
60
18.4
3.7
4.3
4.1
3.9
4.3
10.4
10.6
12.6
14.0
18.6
37.3%
37.0%
32.0 %
29.4%
55.7%
18.2
25.0
29.0
29.8
2019
2020
2021
2022
2023
Personnel expenses Depreciation and amortisation expenses Other expenses Cost to Income ratio
%
LKR billion
The increase of personnel cost compared to last year was 3%, but the cost to income ratio of the Bank stood at 55.7% mainly due to the increase in interest cost and other expenses.
Taxation
BoC created a value of LKR 25.7 billion to the Government in the form of taxes during the year. The Bank incurred total income tax expenses amounting to LKR 13.6 billion for the year, marking a growth of 1,471% from the prior year’s reversal of LKR 1.0 billion. As per the Inland Revenue Act No. 45 of 2022, the corporate income tax rate of 30% was applied on the taxable income of the Bank.
Taxes on financial services increased by 12% to LKR 12.7 billion in line with the strong growth in operating profitability.
GRI 207- 1 to 4
Approach to taxation: The Bank’s tax strategy is directed by its Board of Directors and implemented by the Finance team. Compliance with tax regulations is monitored on an ongoing basis by the Internal Audit team with independent evaluation carried out by the external auditors at the end of the fiscal year.
The responsibility of liaising with the tax authorities and filing of tax returns with the respective departments of the Inland Revenue lies with the tax division and necessary consultancy is obtained by external expertise to tax advisory service. BoC was in adherence with all tax regulations of each country of operation and no incidents of non- compliance were reported during the year.
Profitability
Despite facing external challenges, the Bank ended the year with a profit before tax of LKR 40.3 billion marking a growth of 30% over 2022. Considering the impact of higher tax expenses, the profit after tax demonstrated a reduction of 16.5%, recording LKR 26.7 billion for the year ending 31 December 2023 compared to LKR 32.0 billion of the prior year.
PROFITABILITY
0
10
20
30
40
50
0.0
0.5
1.0
1.5
2.0
23.1
0.9%
1.3%
1.3%
0.8%
0.9%
17.8
37.6
32.0
26.7
2019
2020
2021
2022
2023
Profit attributable to shareholder ROA
%
LKR billion
PRIORITY AREA 02:
STRENGTHENING THE
FINANCIAL POSITION
Total assets
During the year, the Bank’s total assets grew by 2% and reached LKR 4.4 trillion, further solidifying its position as a leader in the industry. The composition of the asset book underwent several changes during the year with subdued credit demand amid weak economic conditions and higher investments in Government debt securities.
ASSET COMPOSITION
0
2,000
4,000
6,000
2019
2020
2021
2022
2023
Loans
Investments
Liquid assets
Other assets
LKR billion
1,549.8
1,988.4
2,413.8
2,325.6
2,209.1
652.9
788.4
1,127.4
1,603.5
1,833.3
119.5
92.9
117.8
88.4
156.8
105.3
198.9
208.5
170.5
198.9
Gross loans marked a decline mainly due to the low credit demand under the high interest rate scenario and the wait and see approach adopted by the investors under uncertain economic conditions. However, during the second half of the year, gross loans increased by 5% (LKR 131.5 billion) showing improved borrower sentiments. However, the net loan portfolio which contributes 50% to the total assets of the Bank decreased by LKR 116.5 billion as of end 2023. Placements with banks witnessed a growth of 355% to LKR 75.0 billion, while Financial Assets measured at Fair Value through Other Comprehensive income which include Investments in Government securities that also increased by 470% to LKR 49.5 billion during the year. Balances with the Central Bank of Sri Lanka decreased by 50% following the downward revision in the SRR rate from 4% to 2%.
The credit risk profile of the Bank was a key concern stemming from the Board and careful strategies were executed to continually monitor asset quality. Adequate provisions were made for expected credit losses and special task forces were created to monitor stage 2 and stage 3 loans, liquidity and capital position of the Bank.
Total Liabilities
Overall liabilities witnessed a yoy increase of 2%, primarily driven by the growth in the Bank's deposit base, which expanded from LKR 3.3 trillion recorded in 2022 to LKR 3.9 trillion as of end 2023.
Savings deposits marked an 85% growth compared to the previous year reaching LKR 1.2 trillion as at year end. Increased appetite for time deposits led to a growth in the LKR time deposit base to LKR 1.7 trillion in 2023 from LKR 1.6 trillion in the previous year. Foreign currency deposits decreased by 7% during the year as a result of the LKR appreciation. The Bank’s CASA ratio increased to 37% from 29% recorded in the previous year.
DEPOSIT COMPOSITION
CASA
Time
%
63%
71%
29%
37%
2022
2023
In December 2023, the Bank successfully issued LKR 10.0 billion worth of BASEL III compliant, Tier II, listed, rated, unsecured, subordinated, redeemable debentures. The debenture issue was oversubscribed, reflecting the strong investor confidence in the Bank.
Capital and liquidity
The Bank recorded a growth in retained earnings which stood at LKR 171.4 billion and shareholder’s total equity reported LKR 251.7 billion as at the year end.
FUNDING COMPOSITION
0
1,000
2,000
3,000
4,000
5,000
2019
2020
2021
2022
2023
Deposits
Borrowings
Equity
2,005.2
2,474.8
2,866.9
3,334.8
3,882.2
267.6
351.5
735.6
747.5
277.8
142.3
156.7
200.8
254.2
251.7
LKR billion
Managing liquidity was a critical concern for the Bank during 2023. The Bank adeptly managed its liquidity position and risk by strategically navigating its deposit base amid the liquidity challenges prevalent in the market and recorded a positive local and foreign currency liquidity position as at year end. Foreign currency liquidity was upheld by strong remittance inflows, as the Bank leveraged its market leadership position and extensive reach.
The Statutory Liquid Assets Ratio of 42.80% (2022: 23.0%) remained well above the regulatory minimum requirement of 20%. Tier I and Total Capital Adequacy ratios stood at 12.76% and 15.84%, well ahead of the regulatory minimum levels of 10% and 14% respectively.
PRIORITY AREA 03:
SHAREHOLDER VALUE CREATION
For the year ended December 31
2023
2022
2021
2020
2019
Return on equity (%)
10.6
14.1
21.0
11.9
16.8
Earnings per share (LKR)
1,067.7
1,278.9
1,503.6
710.6
971.8
Dividends per share (LKR)
6.9
13.9
73.9
63.9
14.6
Net Assets Value (NAV) per share (LKR)
10,068.6
10,167.4
8,030.4
6,266.4
5,691.3
Despite of the unexpected headwinds, the Bank navigated challenges without compromising the value generation for shareholder and as well as for other stakeholders.
The Bank was able to maintain a better trade off between its key concern of strengthening the Financial Position and generating return to shareholder by maintaining Return on Equity (ROE) above 10%.
Value creation to other stakeholders are presented in pages 84 to 109
Overseas operations and Group performance
The contribution of overseas branches in Male, Chennai and Seychelles to the PBT was 20% during the year.
At the consolidated level, Group pre-tax-profits for the year recorded LKR 41.7 billion, with a growth of 35% compared to the year 2022. As at end of 2023, the Bank had nine subsidiaries and four associate companies which are involved in diverse operations ranging from financial services, property management services and leisure management, among others. The Bank also operates a foreign subsidiary, which has facilitated market access in the United Kingdom while enhancing reputation and providing an effective platform to obtain foreign exposure for the staff.
The Bank is by far the dominant entity within the Group, accounting for 99% of total assets. The subsidiaries are managed under a subsidiary charter that includes an annual comprehensive subsidiary performance review. The financial and operational performance of the subsidiaries are monitored by the parent entity on a regular basis while risk dashboards are shared with the Bank’s Chief Risk Officer to ensure that risks are managed within acceptable levels in line with the Group’s overall risk appetite. Meanwhile, a representative from the Bank typically holds a Board position to ensure that subsidiary and associate operations are conducted in line with the expectations of the parent entity.
WAY FORWARD
As Sri Lanka experiences inevitable macro-economic pressure in the short-term, the Bank remains committed to supporting customers to ensure their long-term sustainability. In line with these aspirations, BoC will also focus on enhancing its capital position through internal and external sources including Tier 2 instrument issues to drive its growth plans. We also hope to obtain from local or international funding agencies at concessionary rates funding while further expanding our low-cost deposit base through proactively identifying and pursuing suitable customers. Strategic focus will also be placed on strengthening our financial reporting through increased digitalisation of processes and embracing emerging international best practices.